Statistics Lecture 3.3: Finding the Standard Deviation of a Data Set
TLDRThe video script discusses the concept of standard deviation and its significance in understanding data variation. It explains how standard deviation measures the spread of data and its relationship with the mean. The empirical rule is introduced, highlighting how it estimates the percentage of data falling within certain standard deviations of the mean in a normal distribution. The script also touches on the concept of variance and its direct relation to standard deviation. Additionally, it addresses the inability to directly compare standard deviations across different units, introducing the coefficient of variation as a percentage-based comparison method.
Takeaways
- 📈 The concept of variation in data sets refers to how the data is spread out or varies piece by piece or as a whole.
- 🔢 The mean or average of a data set is not the sole indicator of its characteristics; variation provides additional insights.
- 🏦 The bank line example illustrates that different systems (e.g., assigned tellers vs. waiting in line) can yield different waiting times, highlighting the importance of variation.
- 🤔 The mean can be the same across different data sets, but the variation (spread) can be vastly different, indicating that the mean alone is insufficient to describe a data set fully.
- 🔢 The range (max value - min value) is a simple measure of variation but can be misleading if outliers are present or if the data set is large and varied.
- 📊 Standard deviation is a more comprehensive measure of variation that calculates the average distance of data points from the mean and is less affected by outliers.
- 📐 The formula for sample standard deviation involves squaring the differences between each data point and the mean, summing these squares, and then taking the square root of the result.
- 📊 Properties of standard deviation include: it's never negative, never zero unless all data points are the same, and it's greatly affected by outliers.
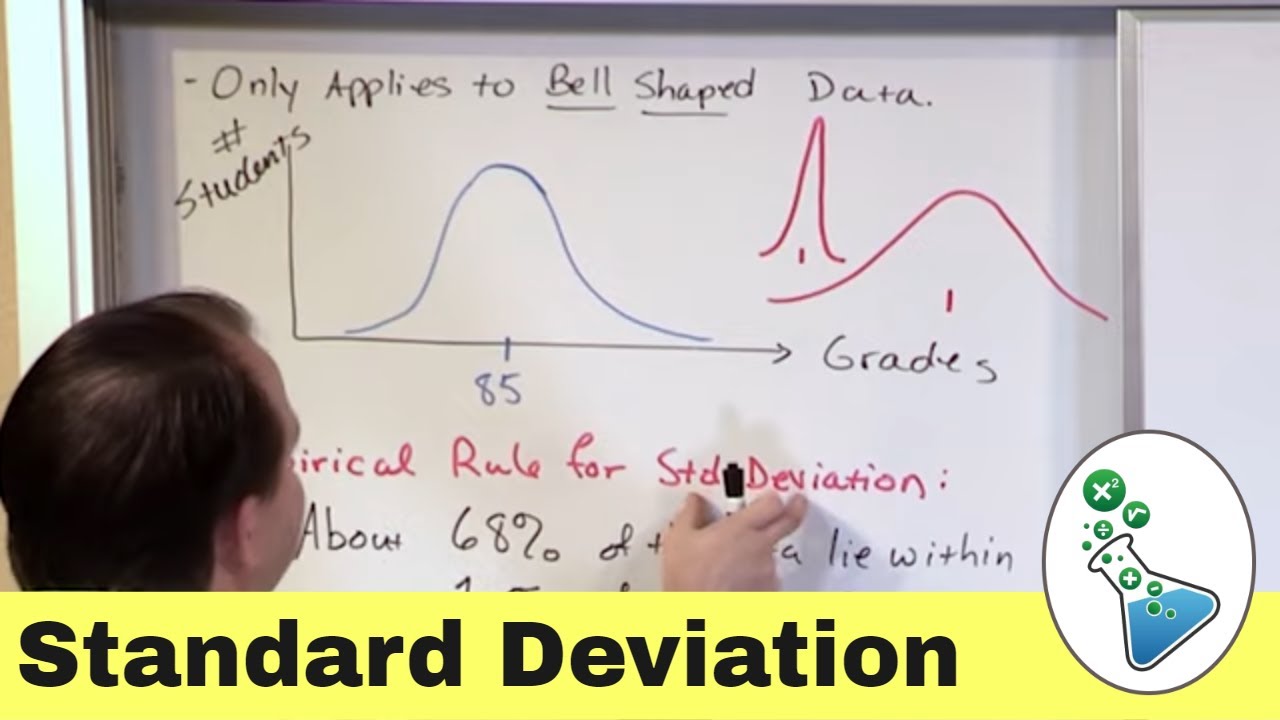
- 📈 The empirical rule (68-95-99.7 rule) states that for a normally distributed data set, approximately 68%, 95%, and 99.7% of the data fall within one, two, and three standard deviations of the mean, respectively.
- 🔢 Variance is another measure of variation that is the square of the standard deviation and represents the average of the squared differences from the mean.
- 📊 The coefficient of variation (standard deviation divided by the mean, multiplied by 100) allows for the comparison of variations between data sets with different units or scales.
Q & A
What does variation in data sets represent?
-Variation in data sets represents how the data is spread out, both piece by piece and as a whole. It indicates the differences and fluctuations within the data points.
Why is it important to understand variation in data sets?
-Understanding variation is important because it provides insights into the diversity and distribution of the data. It helps to identify patterns, outliers, and the overall consistency of the data set, which is crucial for accurate data analysis and interpretation.
What is the significance of the average in data analysis?
-The average, or mean, is significant in data analysis as it provides a central value that represents the overall data set. However, it is not the only measure of importance; other measures like variation give a more comprehensive understanding of the data.
How does the banking example illustrate the concept of variation?
-The banking example shows that even though the mean waiting time across three different banks is the same, the variation in waiting times is different. This demonstrates that the mean does not capture the full story of the data set, and understanding variation is crucial.
What is the range and how does it measure variation?
-The range is the difference between the highest and lowest values in a data set. It is the simplest measure of variation, indicating the extent of the data spread. However, it can be misleading if there are outliers or if the data is skewed.
What are the limitations of using the range as a measure of variation?
-The range only considers the highest and lowest values in the data set, ignoring all other data points. This can be problematic as it does not provide a comprehensive view of the data spread, especially in large data sets or when outliers are present.
What is standard deviation and why is it important?
-Standard deviation is a measure of the average distance of each data point from the mean. It is important because it provides a more accurate and comprehensive measure of variation than the range, considering all data points and their distances from the mean.
How does standard deviation relate to the mean and variation in a data set?
-Standard deviation relates to the mean by measuring the average distance of all data points from the mean. It relates to variation by quantifying how much the data points deviate from the mean, providing a clear indication of the data set's spread and consistency.
What are some properties of standard deviation?
-Some properties of standard deviation include: it is never negative, it is zero only when all data points are the same, and it is greatly affected by outliers. Standard deviation also provides a more accurate measure of variation compared to the range.
How does the empirical rule apply to standard deviation and data distribution?
-The empirical rule states that for a normally distributed data set, approximately 68% of the data falls within one standard deviation of the mean, 95% within two standard deviations, and 99.7% within three standard deviations. This rule provides a general guideline for understanding the spread and concentration of data around the mean.
What is the significance of a data value being within or outside certain standard deviations of the mean?
-A data value within one standard deviation of the mean is considered usual or normal. Within two standard deviations, it is still considered usual, but outside of two standard deviations, it is considered unusual. Being outside of three standard deviations is extremely rare and indicates a significant deviation from the norm.
Outlines
📊 Understanding Variation in Data Sets
The paragraph discusses the concept of variation in data sets, emphasizing that it's not just about the average but also how the data is spread out. An example of bank lines is used to illustrate how the average waiting time doesn't provide the full picture. The speaker introduces the idea of calculating variation and discusses the importance of understanding data spread for making informed decisions.
📈 Calculating the Mean and Variation
This section delves into the calculation of the mean for three different data sets representing bank waiting times. The speaker highlights that while the mean can provide a general idea, it doesn't capture the variation within the data. The concept of variation is further explained through the example, showing that different data sets can have the same mean but different levels of variation.
📊 Exploring the Range and Standard Deviation
The speaker introduces the range as a simple measure of data spread, explaining its calculation and limitations. The concept of standard deviation is then introduced as a more comprehensive measure of variation. The speaker explains that standard deviation is never negative and is greatly affected by outliers, emphasizing its importance in data analysis.
📈 Formula for Sample Standard Deviation
The paragraph presents the formula for calculating the sample standard deviation. The speaker explains each component of the formula, from finding the distance of each data point from the mean to squaring and summing these distances. The process of dividing by 'n-1' is also discussed, highlighting why it leads to an overestimation of variation in sample data.
📊 Alternative Formula for Standard Deviation
An alternative formula for calculating the standard deviation is introduced, which does not require prior calculation of the mean. The speaker explains the steps involved in this method and compares it to the previous formula, noting that both yield the same result. The convenience of this method for handling large data sets is emphasized.
📈 Applying Standard Deviation Calculation
The speaker demonstrates how to apply the standard deviation formula to the bank line data, walking through the process of creating a table, calculating distances from the mean, squaring these distances, and summing them. The process of dividing by 'n-1' and then taking the square root to find the standard deviation is clearly outlined.
📊 Comparing Data Sets Using Standard Deviation
The standard deviation for two different data sets is calculated and compared. The speaker emphasizes that even though the means of the data sets might be the same, the standard deviation can differ significantly, indicating different levels of spread. The impact of outliers on standard deviation is also discussed, showing how they can greatly influence the perceived variation in a data set.
📈 Understanding Population Standard Deviation
The speaker introduces the concept of population standard deviation, distinguishing it from sample standard deviation. The use of Greek letters for population statistics is explained, and the formula for calculating population standard deviation is presented. The speaker clarifies that population standard deviation does not include the 'n-1' adjustment, as it represents the entire population rather than a sample.
📊 Variance and Its Relationship with Standard Deviation
The concept of variance is introduced as another measure of data variation, explained as the square of the standard deviation. The speaker clarifies that variance and standard deviation are closely related, with variance being the number before the square root operation in standard deviation calculation. The difference between sample variance and population variance is also discussed.
📈 Empirical Rule and Its Application
The empirical rule, also known as the 68-95-99.7 rule, is introduced as a way to approximate the proportion of data within certain standard deviations of the mean in a normally distributed data set. The speaker explains how this rule provides a quick way to estimate where most of the data falls and how it can be used to identify unusual data points.
Mindmap
Keywords
💡variation
💡mean
💡standard deviation
💡empirical rule
💡data distribution
💡bank lines
💡outliers
💡range
💡sample
💡calculation
💡statistical inference
Highlights
Exploring the concept of variation in data sets and how it reflects the spread of data points.
Introducing the concept of standard deviation as a measure of data variation.
Discussing the importance of standard deviation over the mean in understanding data sets.
Illustrating the concept of variation with a real-world example of bank lines.
Comparing different methods of organizing bank lines and their impact on customer wait times.
Explaining how the mean can be deceiving when trying to understand the full picture of a data set.
Introducing the range as a simple measure of data spread, but highlighting its limitations.
Discussing the drawbacks of using the range when outliers are present in the data set.
Explaining the concept of sample standard deviation and its calculation.
Highlighting the properties of standard deviation, including its non-negativity and sensitivity to outliers.
Introducing the empirical rule and its application to normally distributed data sets.
Describing how the empirical rule helps in estimating the proportion of data within certain standard deviations of the mean.
Clarifying the difference between usual and unusual data values based on their proximity to the mean.
Discussing the concept of variance as a precursor to calculating standard deviation.
Explaining the relationship between sample variance, population variance, and their respective standard deviations.
Detailing the process of calculating standard deviation using two different formulas and their applications.
Demonstrating the use of calculators to efficiently calculate standard deviation and variance.
Introducing the coefficient of variation as a tool to compare the spread of data across different units or scales.
Stressing the importance of understanding the context and characteristics of data before applying statistical measures.
Transcripts
Browse More Related Video
Empirical Rule of Standard Deviation in Statistics
What Is And How To Use Chebyshev's Theorem And The Empirical Rule Formula In Statistics Explained
Understanding Standard deviation and other measures of spread in statistics

Standard Deviation and Coefficient of Variation

Elementary Statistics - Chapter 6 Normal Probability Distributions Part 1

Standard Deviation and Variance
5.0 / 5 (0 votes)
Thanks for rating: