Standard Deviation and Variance
TLDRThis script explains the concept of standard deviation and its distinction from variance. It illustrates standard deviation as a measure of how data points, such as heights in a group, deviate from the mean. The process involves calculating the mean, finding individual deviations, and then determining the average deviation, which is the standard deviation. The script clarifies that there are two formulas for standard deviation, one for a population and one for a sample, with the latter using n-1 in the denominator. It also explains variance as the square of the standard deviation, making it more abstract and less intuitive than standard deviation, which retains the units of the original data for easier interpretation.
Takeaways
- 📏 Standard Deviation: It's a measure that shows how much data points spread out from the mean.
- 🧩 Calculating the Mean: To find the mean, sum all individual heights and divide by the number of people.
- 📊 Deviation from Mean: Each person's height is compared to the mean to find out how much they deviate.
- 🔢 Average Deviation: The standard deviation represents the average amount by which people deviate from the mean, not individual deviations.
- 📐 Formula for Standard Deviation: The standard deviation is calculated using the square root of the sum of squared deviations divided by the number of values (n or n-1).
- 🎯 Population vs. Sample: Use n for the entire population's standard deviation and n-1 for a sample to estimate the population's standard deviation.
- 📘 Variance vs. Standard Deviation: Variance is the squared standard deviation, without taking the square root.
- 🔍 Units of Measurement: Standard deviation shares the same unit as the original data, making it easier to interpret.
- 📈 Variance Interpretation: Variance is harder to interpret because its unit is the square of the original data's unit.
- 📚 Importance of Standard Deviation: It's preferable to use standard deviation to describe data for ease of understanding.
Q & A
What is the standard deviation and what does it measure?
-The standard deviation is a statistical measure that indicates how much data points scatter around the mean. It measures the average distance of each data point from the mean value.
How is the mean calculated in the context of standard deviation?
-The mean is calculated by summing the heights (or any other measurements) of all individuals and dividing it by the number of individuals.
What does the deviation of a person from the mean represent?
-The deviation of a person from the mean represents how far that individual's value is from the average value of the group.
Why do we calculate the standard deviation and not just the average deviation?
-We calculate the standard deviation because it gives us a measure of how much, on average, the individuals deviate from the mean value, rather than just the average deviation which would be the arithmetic mean of the individual deviations.
What is the formula used to calculate the standard deviation?
-The standard deviation formula is the square root of the sum of the squared deviations of each data point from the mean, divided by the number of values (n) or (n-1) depending on whether you are calculating the population or sample standard deviation.
Why are there two different equations for calculating the standard deviation?
-There are two different equations because one is used when calculating the standard deviation of an entire population (dividing by n), and the other is used when estimating the population standard deviation from a sample (dividing by n-1).
What is the difference between the standard deviation and the variance?
-The standard deviation is the square root of the variance. The variance is the average of the squared differences from the mean, whereas the standard deviation is the square root of this value, making it in the same unit as the original data.
Why is the standard deviation preferred over variance for describing data?
-The standard deviation is preferred because it is in the same unit as the original data, making it easier to interpret and understand. The variance, being the square of the standard deviation, is in the square of the original unit, which can be more difficult to interpret.
What is the significance of using n-1 when estimating the standard deviation from a sample?
-Using n-1 in the calculation provides an unbiased estimator of the population standard deviation. It accounts for the fact that a sample is a subset of the population and gives a better estimate of the variability within the entire population.
How does the standard deviation help in understanding the spread of a dataset?
-The standard deviation gives a measure of the amount of variation or dispersion in a dataset. A low standard deviation indicates that the data points are close to the mean, while a high standard deviation indicates that the data points are spread out over a wider range.
Outlines
📏 Understanding Standard Deviation and Variance
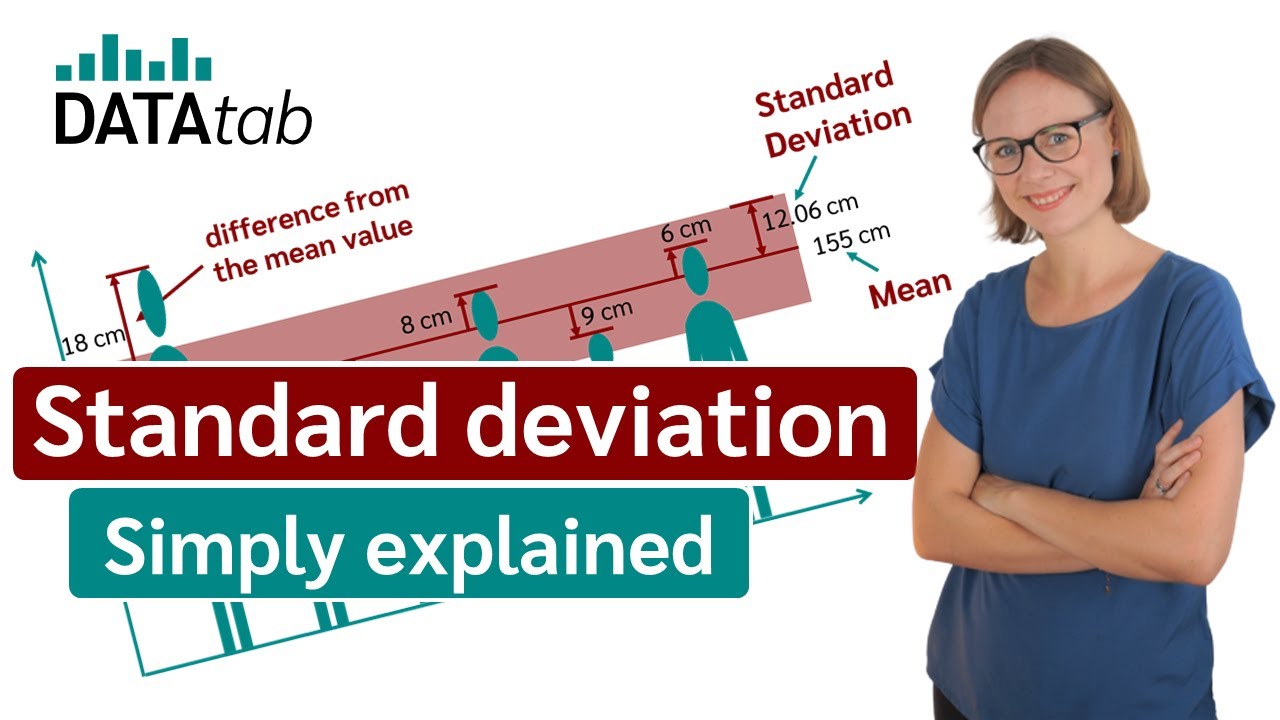
The first paragraph introduces the concept of standard deviation as a measure of how data points scatter around the mean. It uses the example of measuring the height of a group of people to illustrate how to calculate the mean and standard deviation. The mean is calculated by summing all heights and dividing by the number of individuals. Deviations of each person from the mean are then squared, summed, and divided by the number of people to find the standard deviation, which represents the average distance from the mean. The paragraph also explains the difference between using 'n' and 'n-1' when calculating the standard deviation for a population or a sample, respectively. It concludes by differentiating standard deviation from variance, noting that variance is the square of the standard deviation.
📐 Clarifying the Role of Standard Deviation and Variance
The second paragraph focuses on the practical use of standard deviation and variance in data interpretation. It clarifies that standard deviation is calculated by taking the square root of the sum of squared deviations, while variance is the result of this calculation without the square root. The paragraph emphasizes that standard deviation is more intuitive and easier to interpret because it shares the same unit as the original data, making it preferable for data description. In contrast, variance is less intuitive due to its unit being the square of the original data's unit, which can complicate interpretation. The paragraph wraps up with a note of thanks for watching the video.
Mindmap
Keywords
💡Standard Deviation
💡Variance
💡Mean
💡Deviation
💡Scatter
💡Population
💡Sample
💡Quadratic Mean
💡Units
💡Interpretation
Highlights
Standard deviation is a measure that indicates how much data scatter around the mean.
Mean is calculated by summing the heights and dividing by the number of individuals.
Deviation is the difference between an individual's height and the mean height.
Standard deviation quantifies the average deviation from the mean.
The standard deviation equation involves summing the square of deviations and dividing by the number of values.
Population standard deviation is calculated using n in the denominator.
Sample standard deviation uses n-1 in the denominator to estimate the population standard deviation.
Variance is the squared standard deviation.
Standard deviation is in the same unit as the original data, making it easier to interpret.
Variance is in the square of the original unit, which is more difficult to interpret.
Quadratic mean is used for standard deviation, not the arithmetic mean.
The difference between standard deviation and variance lies in the square root application.
When the survey doesn't cover the whole population, n-1 is used for standard deviation calculation.
In clinical studies, n-1 is used to infer the population's standard deviation.
The average deviation from the mean is calculated by adding up all deviations and dividing by the number of participants.
The example given uses the height of a group of people to illustrate the concept of standard deviation.
The video provides a step-by-step explanation of how to calculate standard deviation.
The video explains the practical applications of standard deviation and variance in data analysis.
Transcripts
Browse More Related Video
Standard deviation (simply explained)
Standard Deviation & Degrees of Freedom Explained | Statistics Tutorial | MarinStatsLectures

Statistics: Standard deviation | Descriptive statistics | Probability and Statistics | Khan Academy
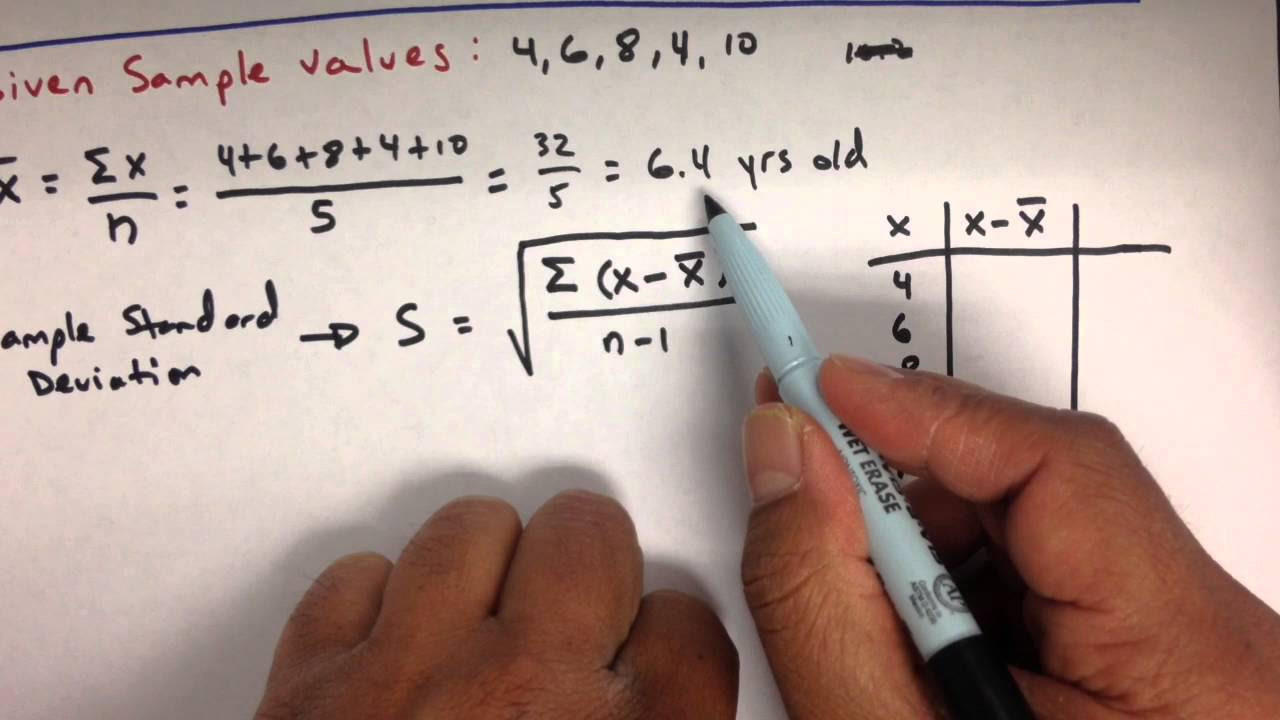
Variance and Standard Deviation: Sample and Population Practice Statistics Problems
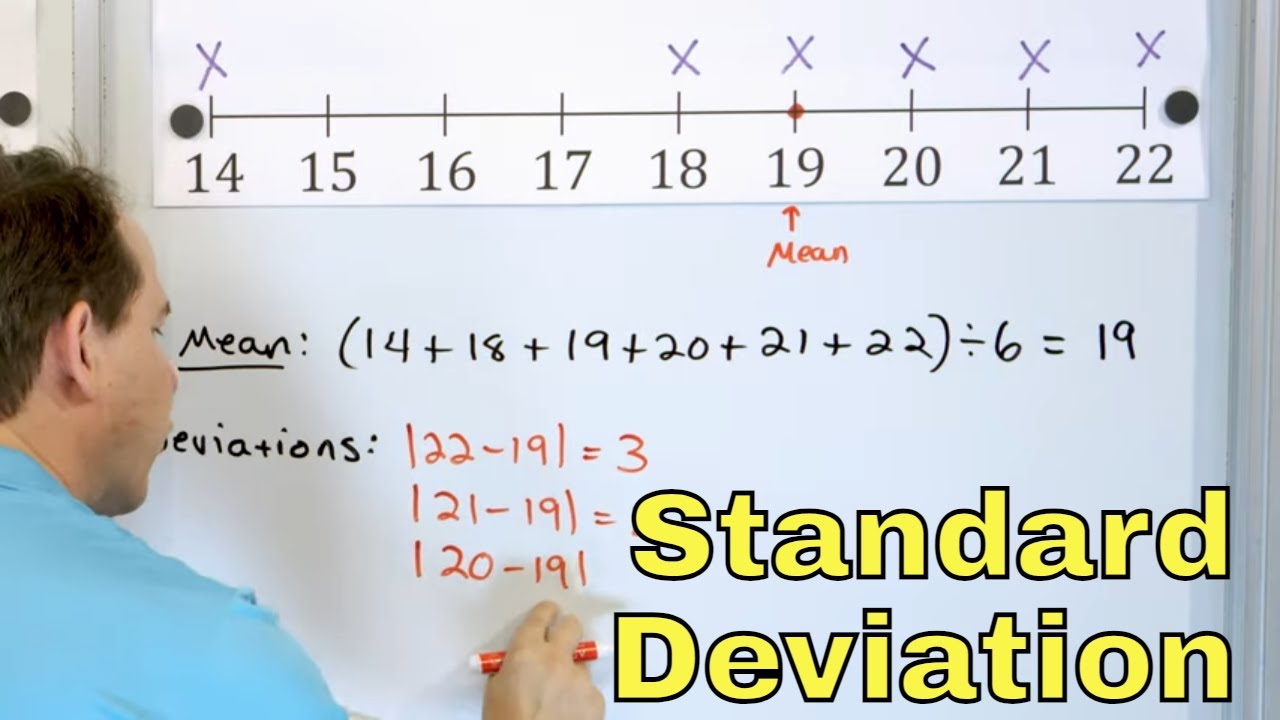
Standard Deviation & Mean Absolute Deviation Explained - 6-8-19]
Standard Error of the Mean: Concept and Formula | Statistics Tutorial #6 | MarinStatsLectures
5.0 / 5 (0 votes)
Thanks for rating: