One Tailed and Two Tailed Tests, Critical Values, & Significance Level - Inferential Statistics
TLDRThis educational video delves into the distinctions between one-tailed and two-tailed tests in hypothesis testing, using a practical example of a company's potato chip bag weights. It explains that the choice between a one-tailed or two-tailed test hinges on the alternative hypothesis. A two-tailed test is used when the hypothesis does not equal a specific value, indicating potential differences in both directions. Conversely, one-tailed tests target specific directions: a left-tailed test for means less than a certain value, and a right-tailed test for means greater than it. The video also covers key concepts like null hypothesis, critical values, significance levels, and how to interpret Z values to make decisions about hypotheses.
Takeaways
- 📝 The choice between a one-tailed and a two-tailed test depends on the alternative hypothesis.
- 📈 A two-tailed test is used when the alternative hypothesis suggests a mean is not equal to a certain value.
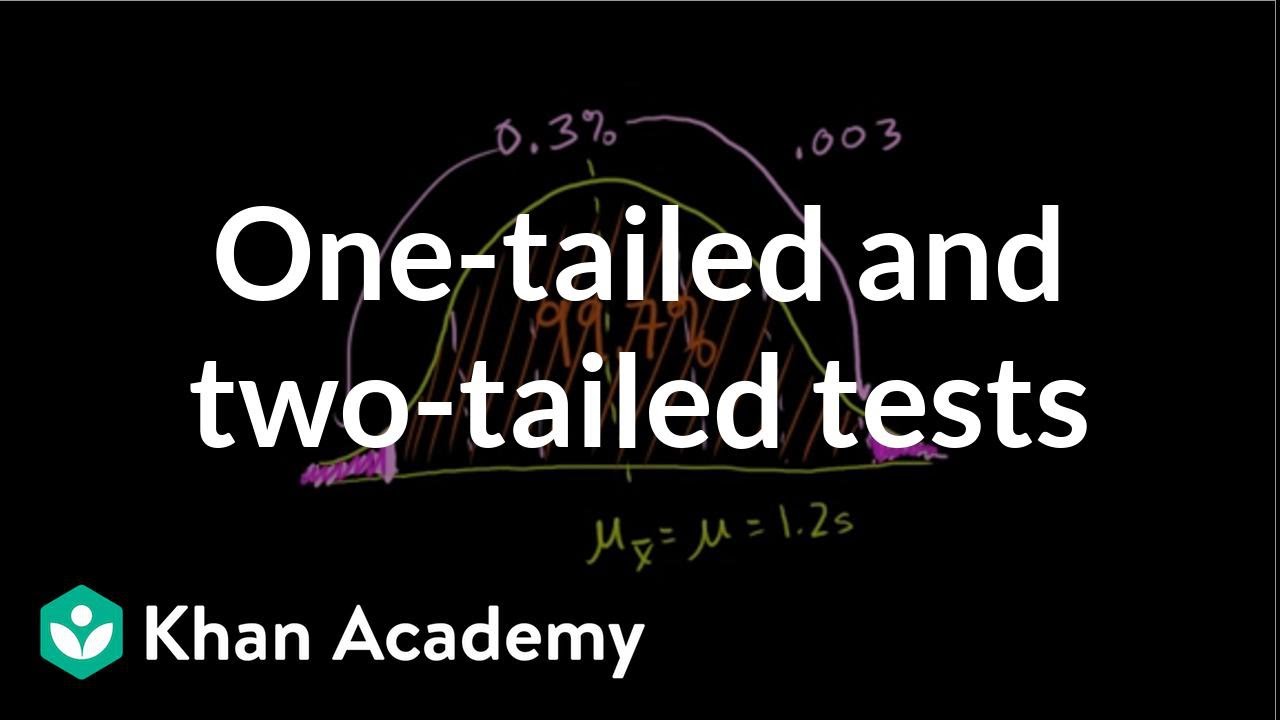
- 📊 In a two-tailed test, rejection regions are on both sides of the distribution, indicating areas where the null hypothesis is rejected.
- 📖 Critical values separate the rejection regions from the fail-to-reject region in the distribution.
- 🔬 The significance level (alpha) is split between two tails in a two-tailed test, each tail having an area of alpha/2.
- 📉 To decide on rejecting or not rejecting the null hypothesis, compare the calculated z value to the critical value.
- 📗 One-tailed tests are divided into left-tailed and right-tailed, based on the direction of the alternative hypothesis.
- 🔥 A left-tailed test is appropriate when the alternative hypothesis suggests the mean is less than a specific number.
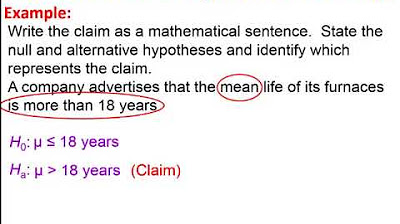
- 💡 A right-tailed test is used when the alternative hypothesis indicates the mean is greater than a certain value.
- 📚 The significance level remains the same (0.05) for both one-tailed and two-tailed tests at a 95% confidence level.
Q & A
What is the null hypothesis in the potato chip bag mass example?
-The null hypothesis is that the average mass of each potato chip bag is 100 grams.
What does the alternative hypothesis propose in the potato chip example?
-The alternative hypothesis proposes that the mean mass of the potato chip bags is not 100 grams.
When is a two-tailed test used in hypothesis testing?
-A two-tailed test is used when the alternative hypothesis specifies that a parameter does not equal a certain value, indicating the possibility of variation in two directions from the null hypothesis.
What do the shaded areas in a two-tailed test represent?
-In a two-tailed test, the shaded areas on both ends of the normal distribution curve represent the rejection regions, where the null hypothesis would be rejected.
What are critical values in the context of hypothesis testing?
-Critical values are the z values that separate the rejection regions from the fail to reject region in a hypothesis test, marking the thresholds for deciding whether to reject the null hypothesis.
How is the significance level (alpha) related to the confidence level?
-The significance level (alpha) is the complement of the confidence level, such that alpha = 1 - confidence level. For a 95% confidence level, alpha would be 0.05.
What determines whether the null hypothesis should be rejected or not?
-The decision to reject or not reject the null hypothesis is based on whether the calculated test statistic (e.g., z value) exceeds the critical value(s), placing it within the rejection region.
What is the difference between one-tailed and two-tailed tests in hypothesis testing?
-One-tailed tests are used when the alternative hypothesis specifies a direction (less than or greater than), while two-tailed tests are used when the alternative hypothesis indicates a parameter does not equal a certain value, suggesting possible differences in both directions.
When should a left-tailed test be used?
-A left-tailed test should be used when the alternative hypothesis suggests that the parameter of interest is less than a certain value.
When is a right-tailed test appropriate in hypothesis testing?
-A right-tailed test is appropriate when the alternative hypothesis suggests that the parameter of interest is greater than a certain value.
Outlines
📈 How to Determine When to Use One-Tailed vs Two-Tailed Tests
This paragraph explains how to determine when to use a one-tailed test versus a two-tailed test when solving hypothesis testing problems. It provides an example of a potato chip company where the null hypothesis is a mean bag weight of 100g. A two-tailed test is used when the alternative hypothesis does not equal a value. One-tailed tests are used when the alternative hypothesis states the mean is less than or greater than a value.
😲 Visualizing the Rejection Regions for Different Test Types
This paragraph further visualizes rejection regions for two-tailed, left-tailed, and right-tailed tests. It explains how to calculate z-values, compare them to critical values, and determine whether to reject the null hypothesis based on where the z-value falls on the distribution.
Mindmap
Keywords
💡Hypothesis Testing
💡Null Hypothesis
💡Alternative Hypothesis
💡Two-tailed Test
💡One-tailed Test
💡Significance Level (Alpha)
💡Critical Values
💡Confidence Level
💡Rejection Region
💡Test Statistic
Highlights
Explanation of when to use a one-tailed test or a two-tailed test in hypothesis testing.
Introduction of the concept of null hypothesis with the example of the average mass of potato chip bags.
Definition of alternative hypothesis and its role in determining the type of test.
Clarification that an alternative hypothesis not equaling a specific value indicates a two-tailed test.
Illustration of a normal distribution and the division between rejection and fail-to-reject regions.
Explanation of critical values and their significance in hypothesis testing.
Introduction of the concept of confidence level and its relation to alpha, the significance level.
Breakdown of the significance level into two parts for a two-tailed test.
Explanation of how to decide on rejecting or not rejecting the null hypothesis.
Introduction and differentiation between left-tail and right-tail tests.
Explanation of when to use a left-tail test based on the alternative hypothesis.
Explanation of when to use a right-tail test based on the alternative hypothesis.
Clarification on the relationship between the type of test and the alternative hypothesis statement.
Summary of how the direction of the alternative hypothesis influences the choice of test.
Closing remarks and encouragement to subscribe for more educational content.
Transcripts
Browse More Related Video
One-tailed and two-tailed tests | Inferential statistics | Probability and Statistics | Khan Academy

Elementary Stats Lesson #18
Elementary Statistics Chapter 8 - Introduction Hypothesis Testing Part 1 Lesson 1

t-Test - Full Course - Everything you need to know

Student's t-test
Hypothesis testing: step-by-step, p-value, t-test for difference of two means - Statistics Help
5.0 / 5 (0 votes)
Thanks for rating: