Conditional Probability With Venn Diagrams & Contingency Tables
TLDRThe video explains the concept of conditional probability, using examples of dice rolls, students in a school, and birds in a zoo. It defines conditional probability as the chance of one event happening, given that another event has already occurred. Formulas are provided, but an intuitive approach of determining how much of one event is contained within another is emphasized. Various sample problems are analyzed by constructing contingency tables and Venn diagrams. The aim is to build understanding of principles behind calculating the probability of something conditional on something else already happening.
Takeaways
- 😀 Conditional probability calculates the probability of one event occurring given that another event has already occurred
- 👍🏻 To find conditional probability, take the probability of both events divided by the probability of the first event
- 📊 You can visualize conditional probability using Venn diagrams showing the intersection between events
- 🤔 The probability of A given B is different than the probability of B given A
- 🎲 Use sample spaces with dice, coins etc to calculate conditional probabilities
- 🔢 Contingency tables help to organize data and visualize conditional probabilities
- 🦜 The transcript provides an example of conditional probability using the features of birds in a zoo
- 🤓 You can often estimate conditional probability by seeing how much of one event makes up the total of another event
- ✏️ The step-by-step examples show how to set up and solve different conditional probability questions
- 🧮 Breaking problems down into visual diagrams and numerical components makes conditional probability more intuitive
Q & A
What does the notation P(A | B) represent in probability?
-P(A | B) represents the conditional probability - the probability that event A will occur given that event B has already occurred.
How can you calculate conditional probability using a simple method?
-Look at how much of event A is contained within event B. The fraction of A that is within B gives the conditional probability P(A | B).
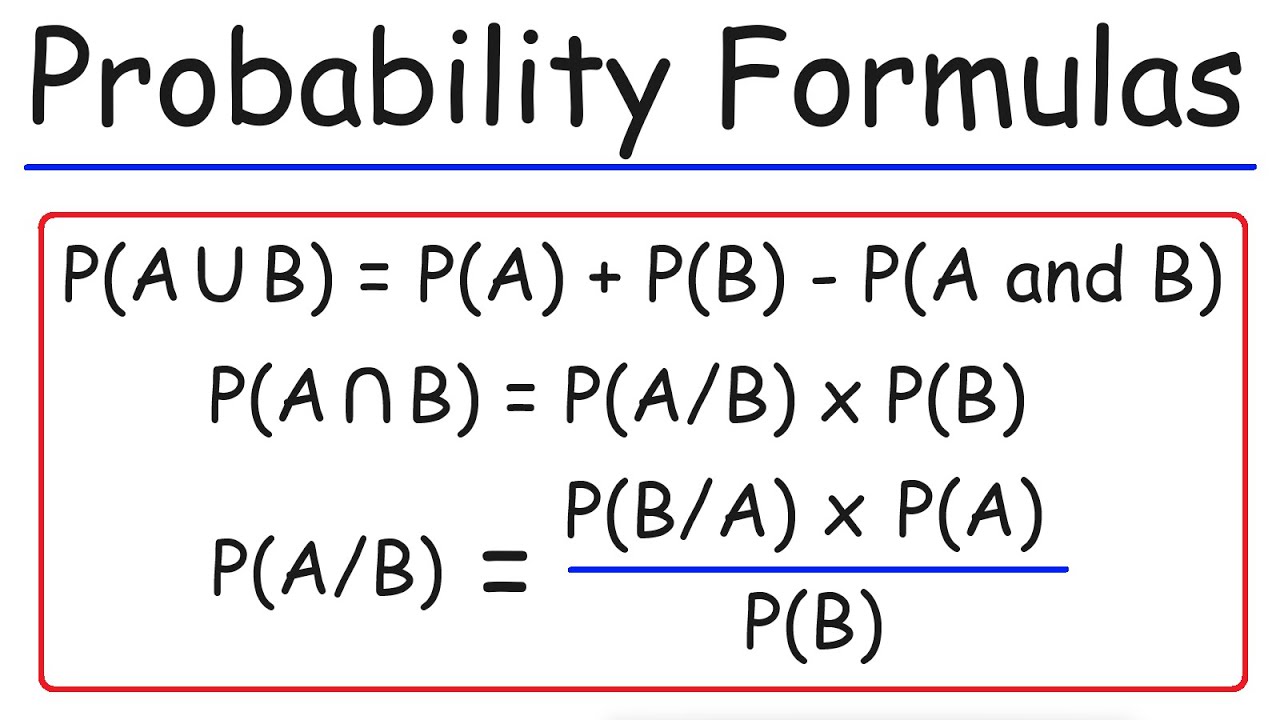
What is the formula used to calculate conditional probability?
-The formula is P(A and B) / P(B), which is the probability of both events occurring divided by the probability of the first event occurring.
In the school student example, what does the probability of 0.2 represent?
-The probability of 0.2 represents that 20% of algebra students are also taking chemistry. Out of 150 algebra students, 30 are taking chemistry.
Why are P(A | B) and P(B | A) not always equal?
-These two conditional probabilities represent different perspectives. P(A | B) asks - out of occurrences of B, how often does A also occur. While P(B | A) asks - out of occurrences of A, how often does B also occur.
What information is contained in a contingency table?
-A contingency table categorizes data across two variables, showing the counts for each combination of categories. It allows you to visualize relationships between the variables.
What does a probability of 0.588 represent in the bird example?
-A probability of 0.588 represents that 58.8% of brown-eyed birds are female. So out of 170 brown-eyed birds, 100 are female.
Why is calculating P(M | BL) simpler than other conditional probabilities?
-There are clear subsets provided - out of 30 blue-eyed birds, 20 are male. So directly 20/30 or 2/3 are male given they have blue eyes.
What information is needed to calculate P(BL | F)?
-You need to know the total number of female birds (110) and the number of those that have blue eyes (10). 10/110 gives the probability.
What is the best approach for tackling conditional probability problems?
-Understand if you need P(A | B) or P(B | A) first. Then break it down using counts - look at the overlap between the two events compared to their totals.
Outlines
📝 Overview of Conditional Probability Concepts
This paragraph provides an introduction to conditional probability using an example with a six-sided die. It explains conditional probability formulas and calculations in simple terms and walks through a step-by-step example problem.
🧮 Conditional Probability Example with Venn Diagram
This paragraph works through a detailed example problem involving conditional probability calculations for students taking algebra and chemistry courses. It utilizes Venn diagrams to visualize the subsets and walks through multiple conditional probability calculations.
🦜 Constructing Contingency Table for Zoo Birds
This paragraph provides a zoo bird example and constructs a contingency table categorizing birds by gender and eye color. It then calculates various conditional probabilities based on the table, interpreting the meaning of each in context.
🐦 Conditional Probability for Female Blue-Eyed Bird
This final paragraph wraps up the zoo bird example by answering one last conditional probability question regarding the chances of selecting a female bird with blue eyes given the prior conditional probability calculations.
Mindmap
Keywords
💡conditional probability
💡sample space
💡intersection
💡contingency table
💡probability formula
💡simplifying
💡set theory
💡Venn diagrams
💡explanation
💡examples
Highlights
Conditional probability is the probability that event A will occur, given that event B has already occurred.
A quick way to calculate conditional probability is to consider how much of event A is within event B.
The formal formula for conditional probability is P(A and B) divided by P(B).
Construct a Venn diagram when dealing with conditional probability word problems.
The probability of A given B is not always equal to the probability of B given A.
Use a contingency table to organize information when multiple categories are involved.
To find P(A given B), determine what fraction of category B is made up by category A.
Conditional probability calculates the likelihood of one event occurring given that another event has already occurred.
Visual representations like Venn diagrams can provide clarity when working with conditional probability problems.
The formula for conditional probability allows you to calculate precise numerical probabilities.
Pay attention to the order - P(A given B) is different than P(B given A). Don't assume they are equal.
Contingency tables help organize data across multiple categories, useful for complex conditional probability problems.
To easily find P(A given B), determine what fraction of B is made up of A. Intuitively see how much of A is 'within' B.
Converting fractions to decimals can help interpret the meaning of conditional probabilities.
Conditional probability calculates the chance of one event occurring given the occurrence of another event.
Transcripts
Browse More Related Video

4.2.5.1 Addition and Multiplication Rules - The Rationale Behind the Multiplication Rule
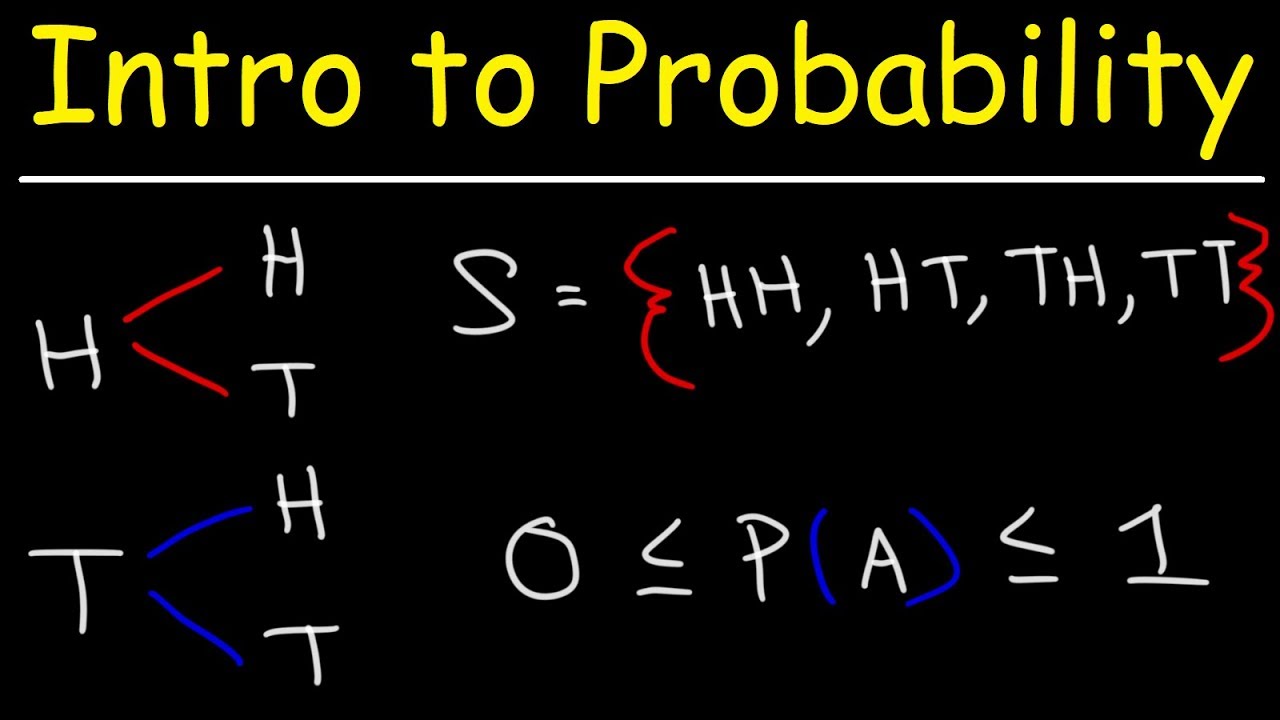
Introduction to Probability, Basic Overview - Sample Space, & Tree Diagrams
Probability Formulas, Symbols & Notations - Marginal, Joint, & Conditional Probabilities

AP Stats Test Quick Review: Probability
4.1.3 Basics of Probability - Finding the probability of the complement of an event

Ex: Find Conditional Probability Using a Table
5.0 / 5 (0 votes)
Thanks for rating: