Understanding Standard deviation and other measures of spread in statistics
TLDRIn this informative video, Dr. Nick explores the concept of summary statistics, focusing on measures of spread to understand data variability. He introduces three key measures: range, interquartile range, and standard deviation, using the example of students' shoe counts. The range, from 2 to 58 pairs, is deemed insufficient due to outliers. The interquartile range, calculated between the lower (5) and upper (12) quartiles, offers a more accurate spread assessment. Standard deviation, derived from variance, quantifies dispersion for any distribution, with most values falling within three standard deviations of the mean. Dr. Nick compares male and female students' shoe data, revealing greater spread and variation among females, as seen in box plots and confirmed by higher standard deviation values. This video serves as a valuable guide for those interested in understanding data spread and its implications.
Takeaways
- 📊 Summary statistics are used to describe the spread, position, shape, and other characteristics of a dataset.
- 📈 Spread in data indicates the amount of variation present; a small spread means values are similar with little variation, while a large spread indicates significant variation.
- 📉 Measures of spread include the range, interquartile range (IQR), and standard deviation, which help quantify the variation in a dataset.
- 👟 The shoe example dataset consists of the number of pairs of shoes owned by students, illustrating how spread is measured.
- 🚫 The range (58-2=56) is not a good indicator of spread as it can be heavily influenced by outliers.
- 🔢 The interquartile range (IQR), calculated as the difference between the upper (12) and lower (5) quartiles, provides a better measure of spread, resulting in 7 for the shoe example.
- 📚 The boxplot is a visual tool that represents the IQR, showing the spread of the middle 50% of the data.
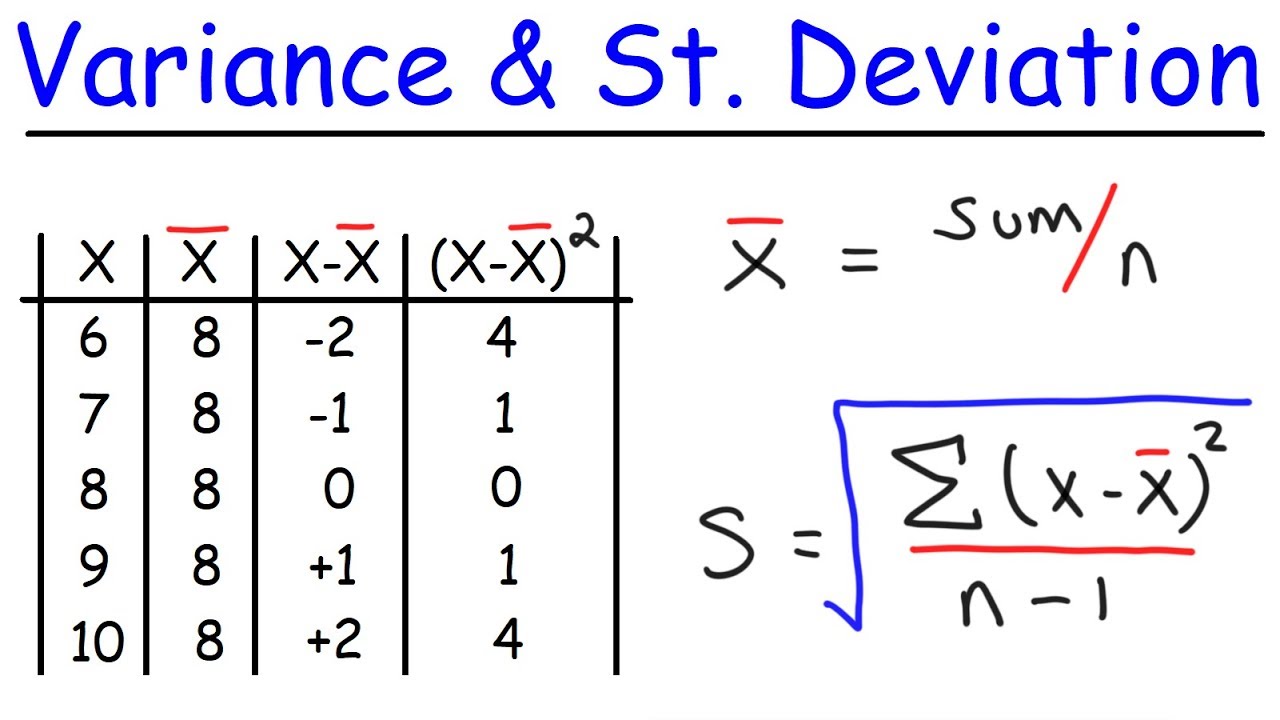
- 🧮 Standard deviation is calculated by finding the mean, subtracting each value to find the difference, squaring it, summing them, dividing by the number of observations, and taking the square root of the variance.
- 🔬 There is a slight difference in the formula for calculating standard deviation for a population versus a sample, but it's negligible for small samples.
- 👦🏻👧🏻 Comparing the spread of male and female students' shoe data reveals that female students have a greater spread, as shown by a wider boxplot and higher standard deviation.
- 📊 Measures of spread are crucial when comparing distributions, as they provide insight into the variation within each group.
Q & A
What are summary statistics and why are they important?
-Summary statistics are numerical measures that describe the main features of a data set, such as its central tendency, spread, and shape. They are important because they provide a quick and efficient way to understand and communicate the key characteristics of the data.
What is the difference between the range and the interquartile range as measures of spread?
-The range is the difference between the maximum and minimum values in a data set, while the interquartile range is the difference between the third (upper) and first (lower) quartiles. The interquartile range is less affected by outliers and provides a better indication of the spread of the middle 50% of the data.
How is the standard deviation calculated for a population?
-For a population, the standard deviation is calculated by finding the difference between each value and the mean, squaring these differences, summing them up, and then dividing by the total number of observations. The square root of this variance gives the standard deviation.
What does the standard deviation indicate about the spread of a data set?
-The standard deviation indicates how much the data points in a set are spread out from the mean. A low standard deviation indicates that the data points are close to the mean, while a high standard deviation indicates that the data points are spread out over a wider range.
Why is the standard deviation a popular measure of spread?
-The standard deviation is popular because it takes into account all the data points and their distances from the mean, providing a comprehensive measure of spread. It is also used in many statistical analyses and is a key concept in probability and statistics.
How can boxplots be used to visualize the spread of a data set?
-Boxplots are graphical representations that show the median, quartiles, and the spread of the data. The 'box' part of the boxplot represents the interquartile range, while the 'whiskers' can represent the range or other measures of spread, such as the minimum and maximum values within a certain distance from the quartiles.
What does the video script suggest about the spread of shoe ownership among male and female students?
-The script suggests that the spread of shoe ownership is different between male and female students. Female students have a greater spread, with a wider interquartile range (20-10=10) and a higher standard deviation (10.6), compared to male students (interquartile range of 7-4=3 and a standard deviation of 5.2).
How does the video script illustrate the concept of spread using the shoe example?
-The video script uses the example of the number of pairs of shoes owned by students to illustrate the concept of spread. It shows how different measures like range, interquartile range, and standard deviation can be used to describe how spread out the data is.
What is the practical difference between calculating the standard deviation for a population and a sample?
-In practice, the difference between calculating the standard deviation for a population and a sample is minimal, especially when the sample size is large. The formula for a sample standard deviation divides the sum of squared differences by the number of observations minus one, while the population standard deviation divides by the number of observations.
Why might the range not be a good measure of spread for the data on shoe ownership among female students?
-The range might not be a good measure of spread for the data on shoe ownership among female students because it is highly influenced by outliers. Since the female students' data is more spread out, the range could be skewed by a few students who own an unusually high or low number of shoes.
Outlines
📊 Understanding Summary Statistics: Measures of Spread
In this educational video, Dr. Nick introduces the concept of summary statistics, focusing on measures that describe the spread of data. He explains that understanding the spread is crucial as it indicates the amount of variation within a dataset. The video covers three primary measures of spread: range, interquartile range, and standard deviation. Using the example of students' shoe counts, Dr. Nick illustrates how to calculate these measures and interpret their values. The range is the difference between the minimum and maximum values, but it can be skewed by outliers. The interquartile range, which is the distance between the first and third quartiles, provides a more stable measure of spread. Lastly, the standard deviation is a widely used measure that quantifies the dispersion of data points around the mean. Dr. Nick explains the calculation process and emphasizes its importance in comparing the spread of different datasets, such as the shoe counts of male versus female students. The video concludes by highlighting the relevance of these measures in statistical analysis and invites viewers to engage with the content through questions and further exploration.
🌟 Wishing Optimal Data Spread
The second paragraph of the script is a brief and somewhat cryptic statement that serves as a wish for the viewer's data to have 'just the right amount of spread.' This could imply a desire for the viewer's datasets to be neither too clustered nor too dispersed, suggesting a balanced and informative distribution of data points. The statement is open to interpretation and may be intended to leave the viewer with a thought-provoking ending to the video, encouraging them to consider the ideal spread in their own data analysis endeavors.
Mindmap
Keywords
💡Summary Statistics
💡Spread
💡Range
💡Interquartile Range (IQR)
💡Standard Deviation
💡Mean
💡Variance
💡Boxplot
💡Population vs. Sample
💡Comparison of Distributions
Highlights
Summary statistics are used to describe the spread of data.
Spread in data indicates the amount of variation.
Range, interquartile range, and standard deviation are measures of spread.
Range can be misleading due to outliers.
Interquartile range divides data into four equal groups.
Interquartile range is calculated by subtracting the lower quartile from the upper quartile.
Boxplot is a visual tool to represent the interquartile range.
Standard deviation measures the average distance of data points from the mean.
Variance is the square of the standard deviation.
Computers are typically used to calculate standard deviation.
Standard deviation indicates the spread of a distribution.
Nearly all values fall within three standard deviations from the mean.
Measures of spread are crucial when comparing two distributions.
Female students' shoe data is more spread out than male students'.
Interquartile range and standard deviation confirm the spread of female students' data is greater.
Graphical representations like dot plots and boxplots help visualize spread.
The video introduces three measures of spread: range, interquartile range, and standard deviation.
Transcripts
Browse More Related Video

Live Day 2- Basic To Intermediate Statistics
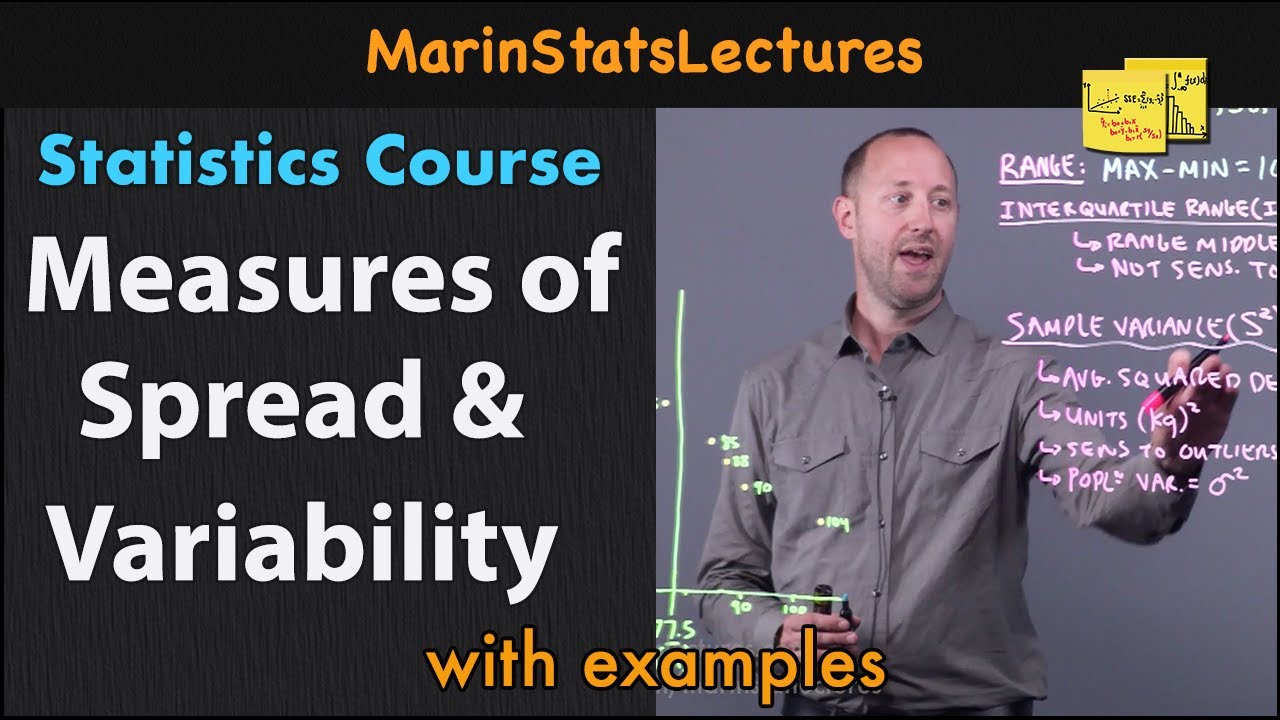
Measures of Spread & Variability: Range, Variance, SD, etc| Statistics Tutorial | MarinStatsLectures
Range, variance and standard deviation as measures of dispersion | Khan Academy
Measures of Spread: Crash Course Statistics #4
Measures of Dispersion (Ungrouped Data) | Basic Statistics
Variance and Standard Deviation With Microsoft Excel - Descriptive Statistics
5.0 / 5 (0 votes)
Thanks for rating: