Probability Tree Diagrams
TLDRThis video explains how to use tree diagrams to solve probability problems. It provides step-by-step examples of creating tree diagrams to represent different scenarios, calculate individual and compound event probabilities, handle problems with and without replacement, independent and dependent events, and apply formulas like P(A or B) = P(A) + P(B) and P(A) = 1 - P(not A). Viewers learn how tree diagrams help organize outcomes and probabilities to tackle multi-step probability questions through several examples including selecting marbles from bags, neighborhood car sampling, and more.
Takeaways
- 😀 Tree diagrams are useful for visualizing all the possible outcomes for probability problems
- 👍 For dependent events, subsequent probabilities change based on prior selections
- 📏 Calculate probability by dividing the number of favorable outcomes by total possible outcomes
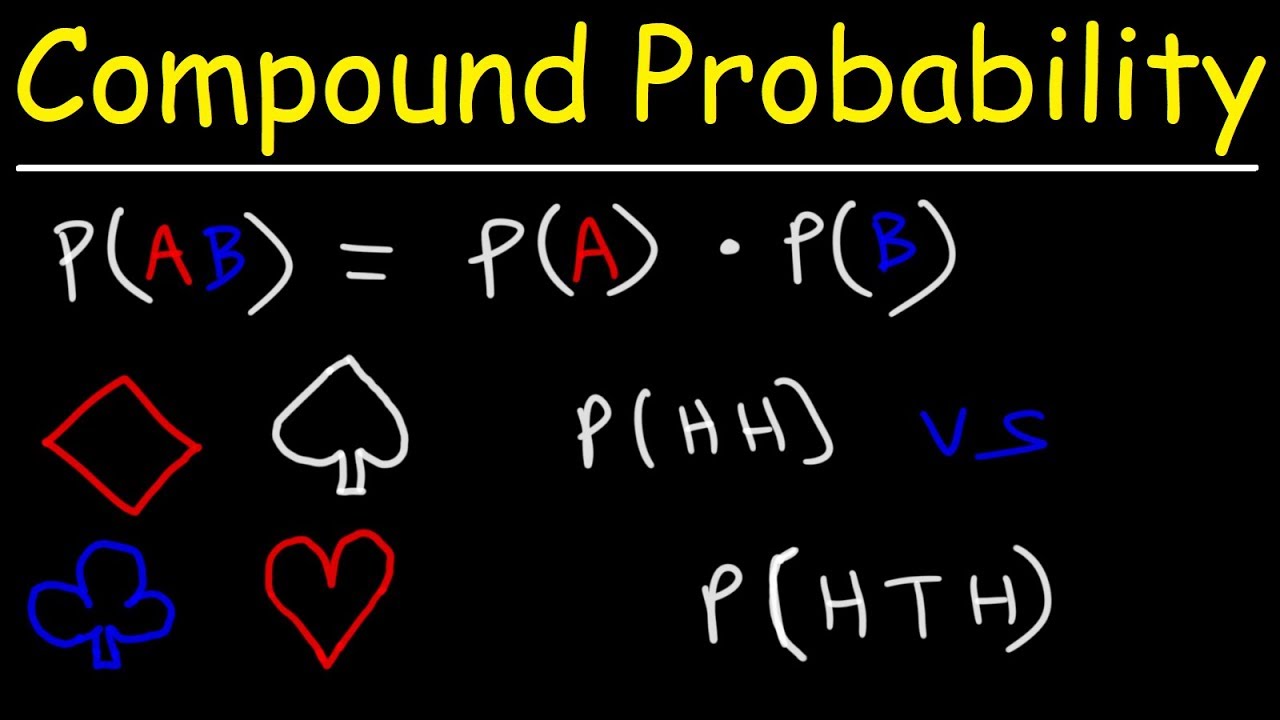
- 🔢 Use AND to multiply probabilities, OR to add probabilities
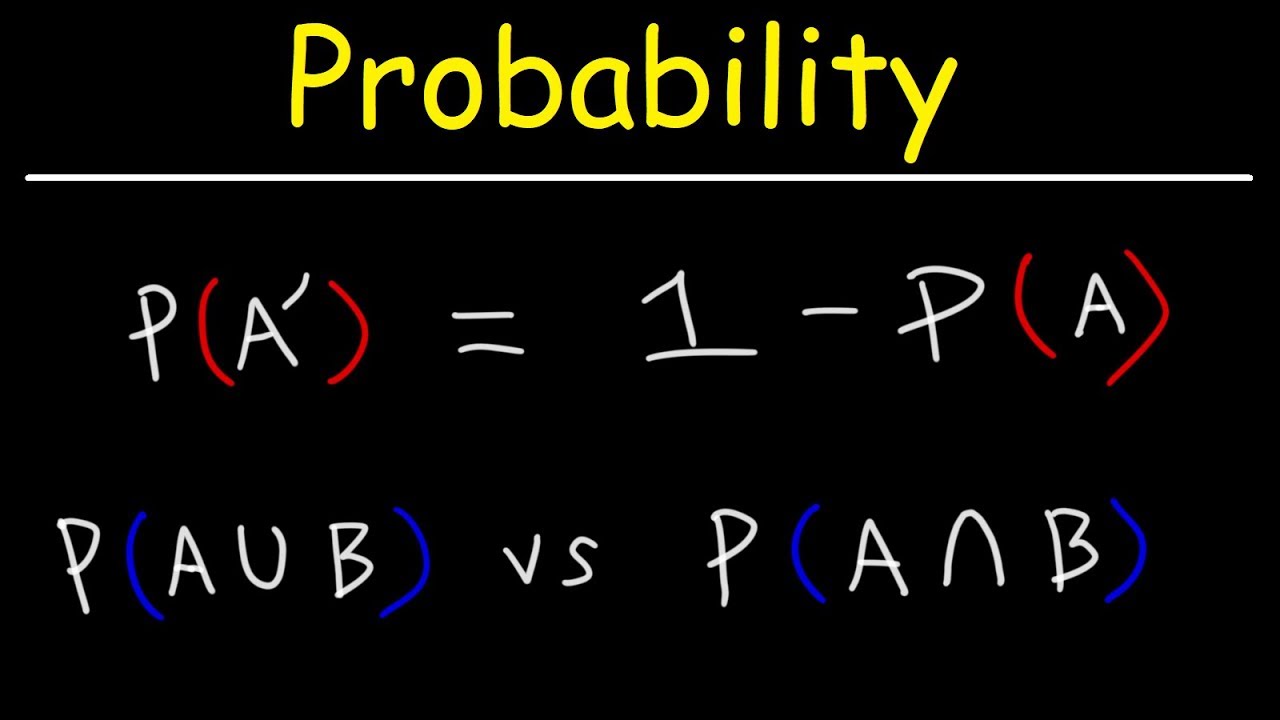
- 💡 The probability of at least one outcome is 1 minus the probability of its complement
- 🎯 Be clear whether order of outcomes matters or not
- 🌳 You can calculate total possible outcomes from tree diagram branches
- ✅ Probabilities on each branch level should sum to 1
- 🖊 Percents and decimals can help calculate part of a whole
- 📈 Using percentages at each branch enables back-calculating totals
Q & A
What is a tree diagram and how is it used to solve probability problems?
-A tree diagram is a graphical representation used to analyze all the possible outcomes of an event. It starts with the initial possibilities and branches out to show all potential outcomes. Tree diagrams help visualize probability problems and make it easier to calculate the probabilities.
What does 'with replacement' mean when selecting multiple items from a population?
-'With replacement' means that after an item is selected, it is placed back into the population before the next selection. So the total population size stays the same for each selection.
What is the difference between dependent and independent events in probability?
-Independent events mean that the outcome of one event does not affect the outcome of another event. Dependent events mean that the outcome of the second event depends on what happened in the first event.
When calculating probability, why do you multiply probabilities for 'and' events but add probabilities for 'or' events?
-For an 'and' statement, you need both events to happen, so you multiply the probabilities. For an 'or' statement, you just need one or the other to happen, so you add the probabilities.
What does it mean when a question asks for the probability of selecting 'at least' one option?
-When asked for the probability of 'at least' one option, it includes getting that option once or multiple times. You calculate this probability by adding up the probabilities of all outcomes with 1 or more of that option.
What is the difference between 'with replacement' and 'without replacement'?
-'With replacement' means putting back each item before selecting again so population size stays the same. 'Without replacement' means the population size reduces by 1 after each selection.
Why does the total of all probabilities on a tree diagram add up to 1?
-Because a probability represents the chance of something happening. Taken together, all possible outcomes must add up to 100% chance or 1.
How do you calculate the total number of outcomes with multiple successive selections?
-Multiply the number of options at each selection stage. E.g. choosing Red or Blue then Red or Blue again is 2x2=4 total possible outcomes.
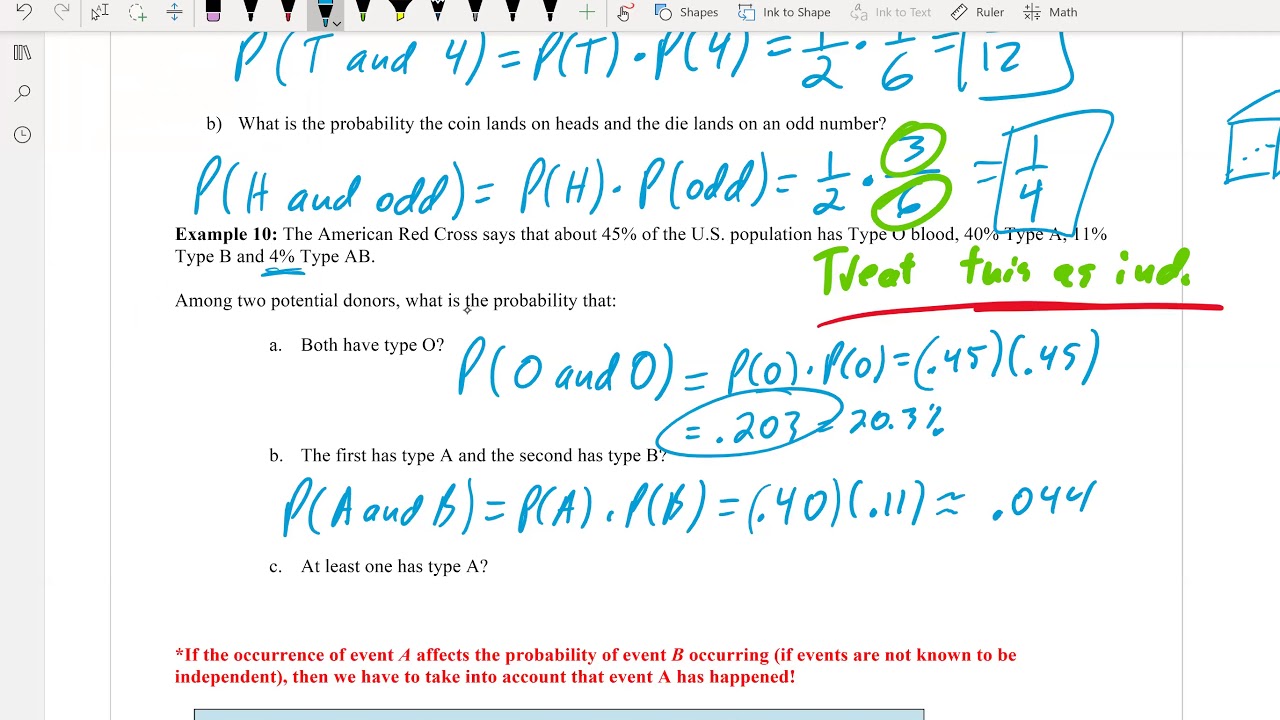
What information is given in the example with cars of different colors and types?
-The total cars, percentage black vs white cars, percentage sedan vs SUV for each color, which provides the count of each subgroup needed to solve the probability questions.
What are the two ways shown to calculate the probability of selecting a black sedan?
-1) Count black sedans and divide by total cars. 2) Multiply % black cars and % black cars that are sedans.
Outlines
📊 Using tree diagrams to calculate probability
This paragraph explains how to use a tree diagram to calculate the probability of selecting two blue marbles from a bag with 8 red and 12 blue marbles. It walks through constructing the tree diagram to represent all possible outcomes and calculating the probabilities along each branch.
🤔 Calculating 'at least one' probability
This paragraph continues the marble probability example, explaining how to calculate the probability of selecting at least one red marble. It shows two methods: 1) adding the probabilities of outcomes with at least one red or 2) using the formula P(at least one red) = 1 - P(no reds).
❗️ Concept of 'without replacement'
This paragraph introduces a new marble probability example involving drawing marbles without replacement. It explains how this changes the probabilities on each draw, since the contents of the bag change after each pick. A tree diagram is constructed to represent this.
🤝 Expanding to three selections
This paragraph builds on the previous marble probability example by having the person select three marbles instead of two. It walks through expanding the tree diagram for three selections and eight possible outcomes. It then calculates the probability of selecting at least one red marble.
😅 Calculating 'at most two' blue marbles
Continuing the three marble selection example, this calculates the probability of selecting at most two blue marbles. It explains this is equal to the probability of not selecting three blue marbles. The concepts of 'at least' and 'at most' probabilities are compared.
🚘 Probability example with cars
This paragraph introduces a more complex, real-world probability example involving different types of cars in a neighborhood. A tree diagram splits up the cars by color and type. It then calculates the probability of selecting a black sedan at random.
💡 Using percentages to calculate probability
Continuing the car example, this shows an alternative way to calculate probabilities using percentages at each branch of the tree diagram. It also answers how many white SUVs are in the neighborhood.
Mindmap
Keywords
💡probability
💡tree diagram
💡replacement
💡dependent events
💡at least
💡exactly
💡at most
💡multiply
💡add
💡percentage
Highlights
Use tree diagrams to visually represent all possible outcomes and calculate probabilities
"And" indicates multiplying probabilities, "or" indicates adding probabilities
With replacement means putting the marble back so probabilities stay the same
The probability of at least one event equals 1 minus the probability of its opposite
Without replacement changes the probabilities for subsequent selections
Dependent events have probabilities that rely on previous events
Independent events have stand-alone probabilities unaffected by other events
Order matters when calculating the specific sequence probability vs. any order
Calculate total outcomes as the number of options raised to the selections power
Use percentages of total and tree diagrams to break down subgroup probabilities
Multiply percentages along branches of tree diagram to get probabilities
Visualizing all possible outcomes helps answer complex probability questions
"At most" means the maximum allowed number, including lower amounts
"Exactly" means only that specific number is allowed, no more or less
Using tree diagrams and percentages can solve complex real-world probability problems
Transcripts
Browse More Related Video
5.0 / 5 (0 votes)
Thanks for rating: