Introduction to Poisson Distribution - Probability & Statistics
TLDRThis video explains how to use the Poisson distribution formula to calculate probabilities for events with a known average rate over a given interval like customers per day. It steps through sample problems showing how to set up the formula, plug in the appropriate values for the average/mean and variable, and calculate cumulative probabilities. It emphasizes understanding how changing the time interval changes the average rate and illustrates shortcuts like factoring out part of the equation. The video aims to equip viewers to apply this distribution to real-world probability problems.
Takeaways
- 😀 The Poisson distribution can be used to find the probability of a certain number of events occurring within a fixed interval if the average rate of events is known.
- 👌🏻 The formula for the Poisson distribution is P(X=k) = (μ^k * e^-μ) / k!, where μ is the average rate and k is the number of events.
- 📊 To use the formula: identify the average rate (μ) and time interval, determine k based on what you want to find the probability for, plug into formula.
- 🤓 Examples show finding probability of exactly a certain number of events, at most a certain number, or more than a certain number.
- ✏️ To find probability of at most or more than a value, you sum or subtract individual probabilities.
- 📈 If the time interval changes, the average rate μ must be adjusted proportionally.
- 🔢 Can set up a proportion to calculate new μ when time changes: μ2/μ1 = T2/T1.
- ⌛ When time interval is fixed, μ stays the same no matter what you are trying to calculate the probability for.
- 📊 The Poisson distribution graph shows probability on y-axis decreasing over increasing x values.
- 😊 Using the distribution properties allows you to calculate cumulative probabilities easily.
Q & A
What is the formula used to calculate probabilities for the Poisson distribution?
-The formula is: P(X=x) = (μ^x * e^-μ) / x!, where μ is the mean, x is the number we want the probability for, and e is approximately 2.71828.
How do you calculate the new mean if the time interval changes?
-You can calculate the new mean by setting up a proportion using the original mean, original time interval, and new time interval. Or multiply the original mean by the ratio of the new time interval to the original time interval.
What does the parameter μ represent in the Poisson distribution formula?
-μ represents the mean or average number of occurrences over the given time interval.
What is the easiest way to calculate the probability that X is less than or equal to a certain number?
-Factor out e^-μ from the full formula. Then add up the individual probability values from X=0 to the target X value.
What is the relationship between the Poisson distribution graph and calculating P(X > x)?
-The total area under the Poisson distribution curve equals 1. So P(X > x) = 1 - P(X ≤ x). This allows you to calculate the probability X is greater than a value without summing the individual probabilities.
What does the X! (X factorial) term do in the denominator of the Poisson formula?
-The X factorial term accounts for the number of ways the event can occur. For example, if X = 3, then 3! = 3*2*1 = 6 different ways for 3 events to occur.
Why can the Poisson distribution be used to model the number of events occurring in an interval of time?
-The Poisson distribution applies when events are independent, occur at a known average rate, and the number of possible events in an interval is very large.
What happens to the Poisson probabilities if you increase the mean μ?
-Increasing μ shifts the distribution to have a higher peak and more spreading. The probabilities for larger numbers of events goes up.
What is a typical application for using the Poisson distribution in the real world?
-The Poisson distribution is commonly used to predict the number of events over time, such as website hits per hour, calls coming into a call center, or accidents occurring.
How can you tell if the Poisson distribution is appropriate to model a process?
-Check if events occur independently at an average constant rate per unit of time, and the number of possible events per unit time is very large.
Outlines
📉 Using the Poisson Distribution Formula
This paragraph explains how to use the Poisson distribution formula to calculate probabilities. It provides an example problem of finding the probability that a small business will receive exactly 8 customers in a day, given that the business receives an average of 12 customers per day. The paragraph walks through applying the formula with the appropriate values to arrive at the final probability.
📈 Adjusting the Formula for Different Time Intervals
This paragraph demonstrates how to adjust the Poisson distribution formula when the time interval changes. It uses an example of calculating the probability of receiving 24 text messages in 8 hours when the original average was 7 texts in 2 hours. To adjust, the mean gets multiplied by the ratio of the new time interval to the original. The adjusted mean is then used in the Poisson formula.
🚀 Calculating Cumulative and Complementary Probabilities
This paragraph shows how to calculate cumulative and complementary probabilities using the Poisson distribution. It first finds the probability of receiving at most 5 calls in an hour when the average is 8 calls. This uses the cumulative Poisson formula. Then it illustrates how to find the probability of more than 6 calls using the complement rule - subtracting the cumulative probability for 6 or less from 1.
🎯 High Chance of Exceeding the Average
The last paragraph concludes by noting that there is a 68.7% chance of exceeding 6 calls in an hour when the average is 8 calls per hour. This makes sense since the average provides the highest probability, so there is a good chance of surpassing smaller values.
Mindmap
Keywords
💡Poisson distribution
💡Mean/Average
💡Time interval
💡Random variable (X)
💡Factorial
💡Cumulative probability
💡E
💡At most
💡More than
💡Change of interval
Highlights
The Poisson distribution formula is used to solve problems involving probability.
The formula calculates the probability of a certain number of events occurring within a fixed interval of time or space.
The mean/average number of events in the interval is represented by μ.
The actual number of events you want the probability for is represented by x.
To change the interval, you must adjust the mean proportionally.
You can calculate cumulative probabilities by factoring out e^-μ.
The total probability under the Poisson distribution curve is 1.
The probability of x > 6 calls equals 1 minus the probability of x ≤ 6 calls.
Poisson distributions are used for modeling random events over an interval.
The distribution can calculate probabilities for an exact number of events.
It can also get cumulative probabilities for ≤ or ≥ than a threshold.
The Poisson is applied in queueing theory, insurance modeling, and more.
The distribution assumes events occur independently in the fixed interval.
As the mean increases, the Poisson distribution approaches a normal distribution.
The Poisson allows modeling low probability events over time or space.
Transcripts
Browse More Related Video

Data Science & Statistics Tutorial: The Poisson Distribution

Poisson process 2 | Probability and Statistics | Khan Academy
Poisson Distribution in R | R Tutorial 3.2 | MarinStatsLectures
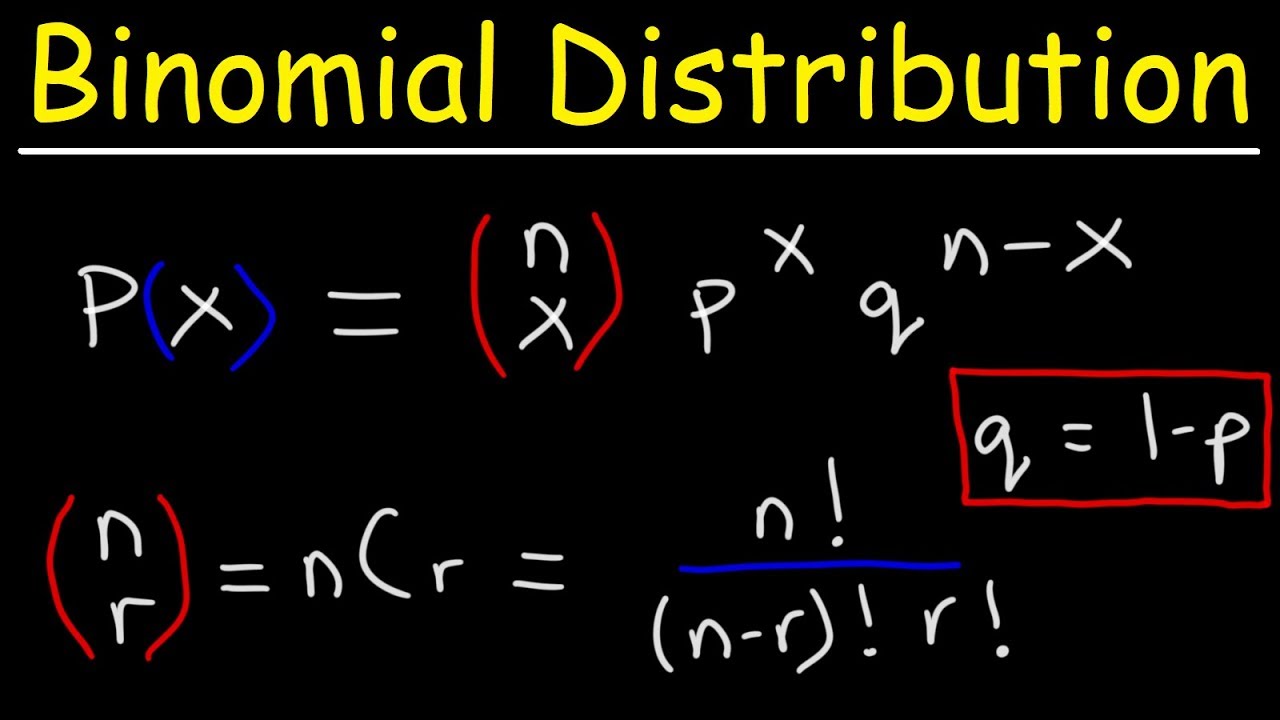
Finding The Probability of a Binomial Distribution Plus Mean & Standard Deviation
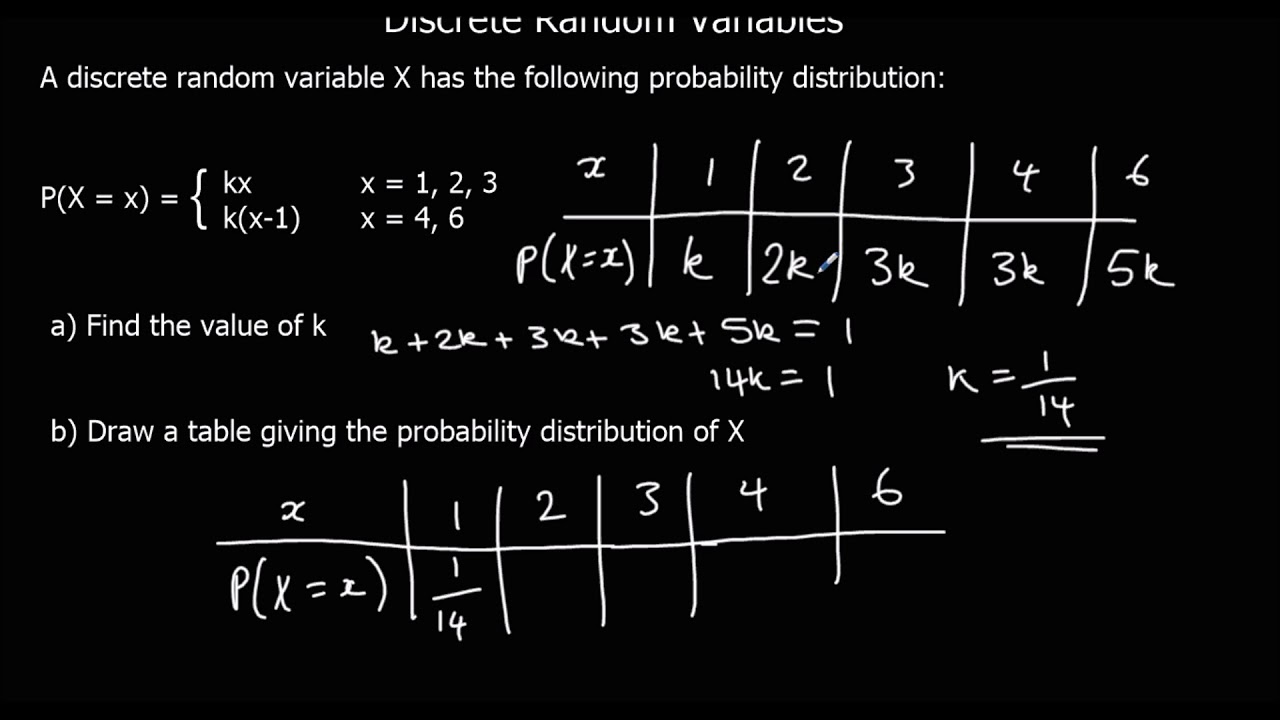
Discrete Random Variables

The Binomial Distribution: Crash Course Statistics #15
5.0 / 5 (0 votes)
Thanks for rating: