Standard Normal Distribution Tables, Z Scores, Probability & Empirical Rule - Stats
TLDRThis statistics video explains key concepts like the standard normal distribution, represented by a bell curve with parameters mean and standard deviation. It covers formulas to calculate z-scores and data values, the empirical rule to determine percentages under the curve, using z-tables to find probabilities, and solving problems to find probabilities of IQ scores and defective tires. Overall, it aims to provide the formulas, concepts, and problem solving approaches needed to put the standard normal distribution to use for statistical analysis.
Takeaways
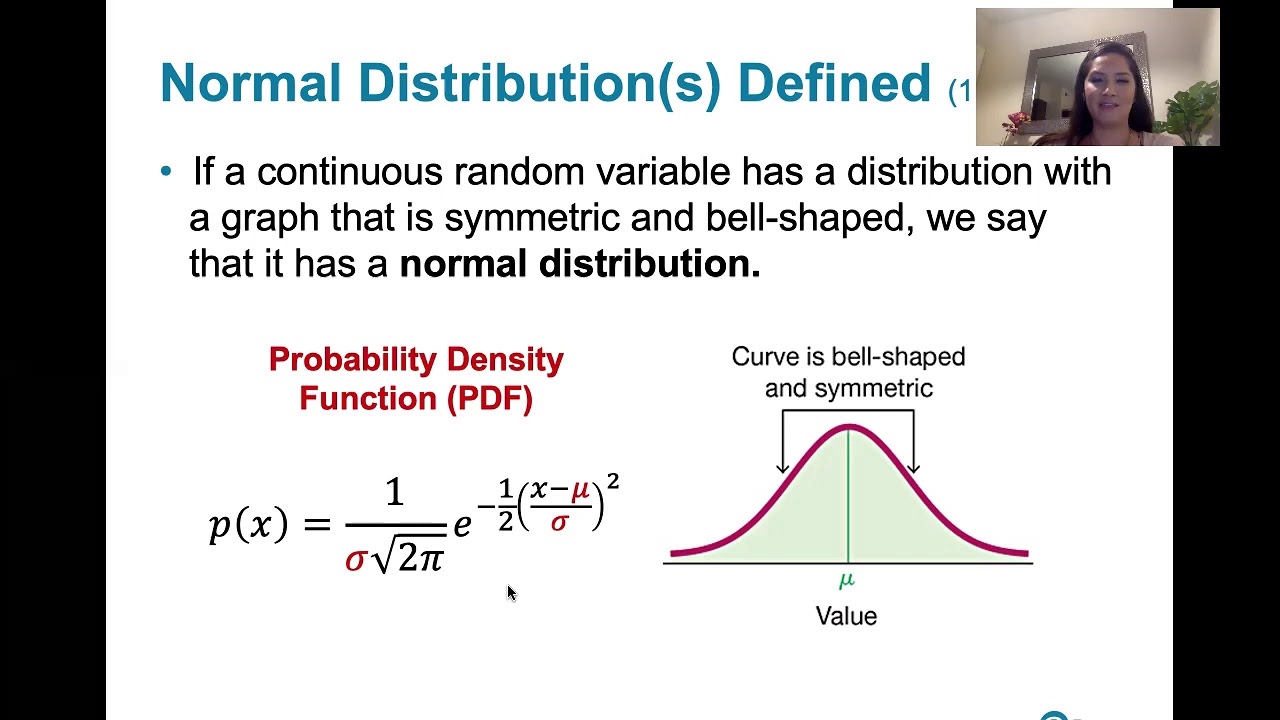
- 😀 The normal distribution is bell-shaped, with key parameters mean and standard deviation
- 😃 Z-scores indicate how many standard deviations from the mean; positive Z is above, negative is below
- 📏 Use formulas to calculate Z-scores and original X values from mean/standard deviation
- 📊 The empirical rule says 68/95/99.7% of values are within 1/2/3 standard deviations
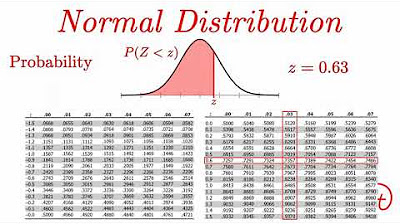
- 📈 Use Z-tables to find area under normal curve and probabilities when Z isn't an integer
- 👩🏫 Explained how to apply empirical rule and Z-tables to IQ test score examples
- 🔬 Gave example problem applying normal distribution to defective product sampling
- 🧮 Showed calculations for mean/standard deviation of defective items using formula
- 📉 Demonstrated finding probability X is less/greater than value using Z-scores
- ✅ Wrapped up summarizing key normal distribution concepts covered in video
Q & A
What is the shape of a normal distribution?
-The normal distribution has the shape of a bell curve.
What are the two important parameters of a normal distribution?
-The two important parameters of a normal distribution are the mean and the standard deviation, represented by the Greek letter sigma (σ).
Where is the mean located on the bell curve of a normal distribution?
-The mean is located right in the middle of the bell curve.
What is the formula for calculating a z-score?
-The formula for calculating a z-score is: Z = (X - μ) / σ. Where X is the data point, μ is the mean, and σ is the standard deviation.
What does the empirical rule state about the percentage of values within 1, 2, and 3 standard deviations of the mean?
-The empirical rule states that approximately 68% of values lie within 1 standard deviation of the mean, 95% within 2 standard deviations, and 99.7% within 3 standard deviations.
When would you need to use a standard normal distribution table?
-You would need to use a standard normal distribution table when you have z-scores that are not whole numbers and you cannot apply the empirical rule. The table allows you to find probabilities for fractional z-scores.
What is the difference between positive and negative z-scores?
-Negative z-scores correspond to data values below the mean. Positive z-scores correspond to data values above the mean.
How can you calculate the x value given a z-score?
-You can calculate the x value using: X = μ + Zσ, where μ is the mean, σ is the standard deviation, and Z is the z-score.
What does the probability density function formula represent?
-The probability density function formula represents the function that describes the relative likelihood of a random variable taking on a given value. For a normal distribution, it shows the probabilities across the range of z-scores.
How do you calculate the area between two x values on a normal distribution?
-Take the difference between the area under the curve up to the upper x value and the area under the curve up to the lower x value. This gives you the area between those two x values.
Outlines
😀 Introducing the standard normal distribution and key formulas
Overview of the standard normal distribution represented by a bell curve. Introduces parameters like mean and standard deviation. Explains z-scores and formulas to calculate them along with x values. Mentions the probability density function.
😃 Explaining the empirical rule for normal distributions
The empirical rule states percentages of data within 1, 2, and 3 standard deviations from the mean. Explains how to calculate area percentages under the curve using this rule.
😊 Positive and negative z-scores in relation to the mean
Positive z-scores are values above the mean, negative z-scores are below. Shows this on a number line with an example.
🙂 Solving an example problem using empirical rule
Goes through a sample problem step-by-step about test scores and a statistics class. Applies empirical rule to calculate probabilities.
🤓 Using z-tables to find areas under the curve
When z-scores are decimals, can't use empirical rule. Have to use z-tables to get area under curve and probabilities instead.
😎 IQ score example problem with z-tables
Works through a question with normally distributed IQ scores using z-tables to calculate various probabilities.
🧐 Determining IQ range for a percentile interval
Shows how to find IQ score range covering the middle 30% of the distribution, mapping percentiles to areas under curve.
🤔 Tire manufacturing sample problem with defects
Statistics example dealing with probabilities around defective tires from a manufacturing process.
😥 Calculating probability tires are defective
Continues tire defect example by finding probabilities for different counts of defective tires.
😌 Wrap up and conclusion
Final paragraph closes video, stating it's the end and hopes viewers found it helpful.
Mindmap
Keywords
💡normal distribution
💡standard deviation
💡z-score
💡empirical rule
💡probability density function
💡mean
💡percentile
💡z-table
💡standard normal distribution
💡variance
Highlights
The normal distribution has the shape of a bell curve
The mean is right in the middle of the bell curve
Negative z-scores are below the mean and correspond to x values below the mean
The empirical rule tells percentages of data within 1, 2, and 3 standard deviations of the mean
You can calculate x given z using: x = mean + z * standard deviation
Use z-tables to find area under normal curve and probabilities when z-score isn't a whole number
Subtract areas under curve from z-tables to find probability x is between two values
Convert percentage to decimal to find number of occurrences from total population
Percentiles relate to area under curve; use z-table to convert between them
Mean defects = sample size x defect probability
Standard deviation defects = square root(sample size x defect probability x non-defect probability)
Probability x < value: (value - mean) / standard deviation, look up z-score in table
Probability x > value: 1 - Probability(x ≤ value)
Probability x between values: Probability(x ≤ upper value) - Probability(x ≤ lower value)
Relate z-scores, x-values, areas under curve, and probabilities to solve problems
Transcripts
Browse More Related Video

Elementary Statistics - Chapter 6 Normal Probability Distributions Part 1

Elementary Stats Lesson #11
6.1.3 The Standard Normal Distribution - Normal Dist. and Properties of the Standard Normal Dist.
6.1.0 The Standard Normal Distribution - Lesson Overview, Learning Outcomes
Normal Distribution EXPLAINED with Examples
ck12.org normal distribution problems: z-score | Probability and Statistics | Khan Academy
5.0 / 5 (0 votes)
Thanks for rating: