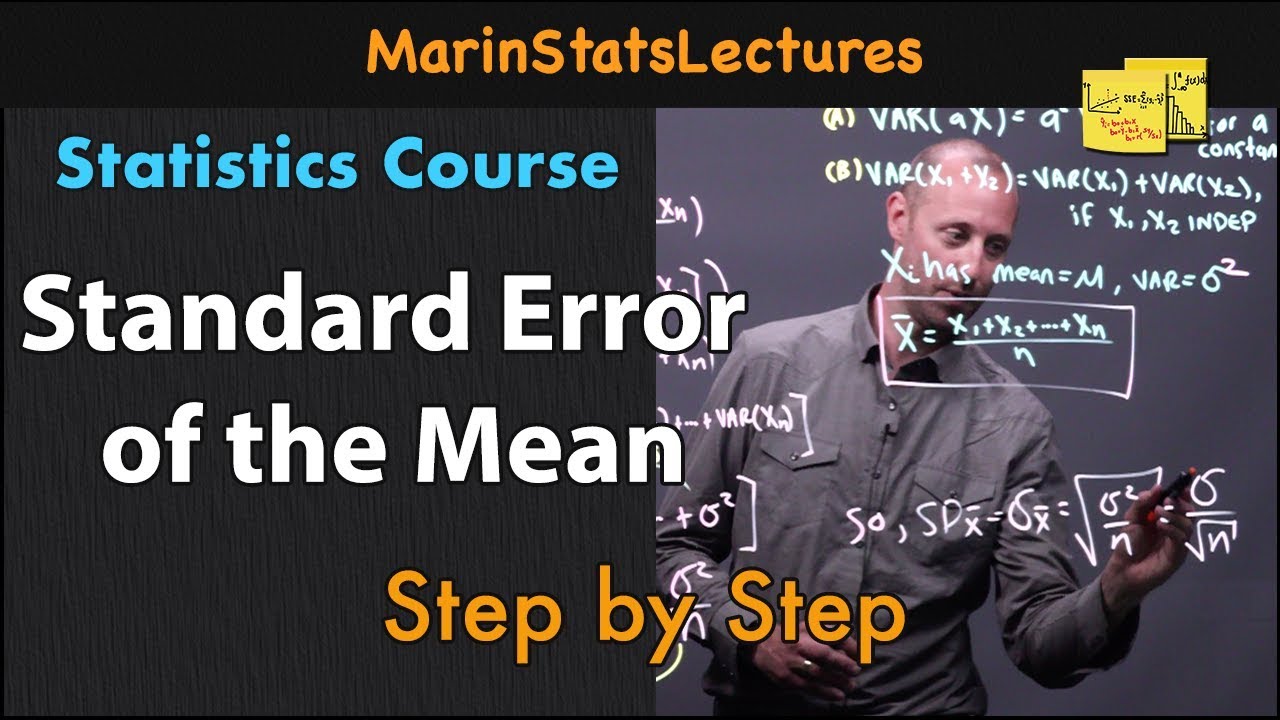
Standard Error of the Mean
TLDRThis video explains how to calculate the standard error of the mean for a sample. It provides two examples, one with a small sample size of 5 students' ages, walking through the full calculation of the standard deviation and standard error. The second uses a larger university sample to demonstrate that as the sample size increases, the standard error decreases, meaning the sample mean approximates the actual population mean more accurately. It visually represents this on a graph showing a narrower, taller normal distribution. Overall it aims to provide instruction on calculating standard error and convey why a larger sample size gives more precise results.
Takeaways
- 😀 The standard deviation measures how spread out data is from the mean
- 📊 To find the standard error, divide the standard deviation by the square root of the sample size
- 🍎 Calculate the mean and standard deviation of a sample to find the standard error
- 🔢 The standard error gets smaller as the sample size increases
- 📈 The standard error represents variability in the sampling distribution of the mean
- 😮 A small standard error means the sample mean is likely close to the population mean
- 🎓 Examples are shown calculating standard error for a sample of student ages
- 📊 The standard deviation of a population is represented by sigma σ
- 🌡️ Increasing sample size narrows the sampling distribution and decreases standard error
- 📉 Less standard error means the sample mean approximates the population mean more accurately
Q & A
What is the difference between the standard deviation of a sample and the standard deviation of a population?
-The standard deviation of a sample is represented by the symbol s and is calculated using the sample data. The standard deviation of a population is represented by the symbol σ and is calculated using data on the entire population.
What is the formula used to calculate the standard error of the mean?
-The formula is: Standard Error = Standard Deviation / Square Root of Sample Size (n)
Why does the standard error decrease when the sample size increases?
-Because the standard error formula includes the square root of the sample size n in the denominator. So as n increases, the denominator increases, resulting in a smaller standard error.
What is the difference between the standard deviation and standard error?
-The standard deviation measures the amount of variability in a data set. The standard error measures how precisely you have estimated the true population mean from your sample data.
What is meant by the sampling distribution of the mean?
-It is the distribution of means from many samples drawn from the same population. Its shape follows a normal distribution centered around the population mean.
How does increasing the sample size impact the sampling distribution of the mean?
-Increasing the sample size makes the sampling distribution narrower and taller in height. This indicates there is less variability around estimating the true population mean.
Why does calculating the standard deviation for a large data set take a long time?
-Because you have to find the difference between each data point and the mean, square each difference, sum them up, divide by n-1, and take the square root. More data points means more computations.
What are some ways to visually represent differences in standard error?
-You can plot sampling distributions, where decreased standard error is shown through a distribution that is narrower and taller in shape.
What impacts whether you calculate standard error or standard deviation?
-If your data comes from a sample, you calculate the standard deviation. If it's population data, you use the standard deviation to determine standard error.
How can you decrease standard error?
-By increasing the sample size n. A larger sample leads to a more precise estimate of the true population parameter.
Outlines
😀 Calculating Standard Deviation and Standard Error
This paragraph provides an example of calculating the standard deviation and standard error for a sample of 5 student ages. The steps to calculate standard deviation are shown, resulting in a value of 3.114. Then the standard error is calculated by dividing the standard deviation by the square root of the sample size n, which is 5, giving a standard error of 1.393.
😀 Calculating Standard Error Using Population Parameters
This paragraph provides an example of calculating standard error using the known population standard deviation rather than a sample standard deviation. With a population SD of 0.8 and sample sizes of 25 and 100 students, the standard error is calculated as the population SD divided by the square root of n. This shows how increasing sample size decreases standard error.
😀 Visualizing the Effect of Sample Size on Standard Error
This paragraph provides a visual graph to represent the effect of sample size on standard error and the sampling distribution. As sample size increases, the graph becomes narrower and taller, representing the decrease in standard error and more accurate approximation of the population mean.
Mindmap
Keywords
💡standard deviation
💡standard error
💡sample size
💡mean
💡population
💡sampling distribution
💡variance
💡precision
💡hypothesis testing
💡confidence interval
Highlights
Calculate the standard deviation of sample ages to find the standard error
Standard error formula: Standard deviation of sample divided by square root of sample size n
As sample size increases, standard error decreases, giving more accurate mean approximation
Population standard deviation used to calculate standard error if known, vs sample standard deviation
Visualize standard error decreasing in sampling distribution graphs as sample size rises
Square root relationship between sample size and standard error causes inverse proportionality
Finding differences from mean, squaring, and summing is done to calculate sample standard deviation
Smaller sample used due to computational complexity of sample standard deviation formula
Mean of ages calculated first before finding sample standard deviation
Each age value substituted in full formula shown for sample standard deviation calculation
Population vs sample standard deviation used correctly in respective formulae
Standard error gives interval estimate of how precisely sample mean estimates population mean
Decreasing standard error improves accuracy of conclusions drawn from sample statistics
Smaller standard error corresponds to narrower sampling distribution centered on true mean
Standard error of 0.16 with sample size 25 decreased to 0.08 with sample size 100
Quadrupling sample size approximately halves the standard error value due to inverse relationship
Transcripts
Browse More Related Video
Standard Error of the Mean: Concept and Formula | Statistics Tutorial #6 | MarinStatsLectures
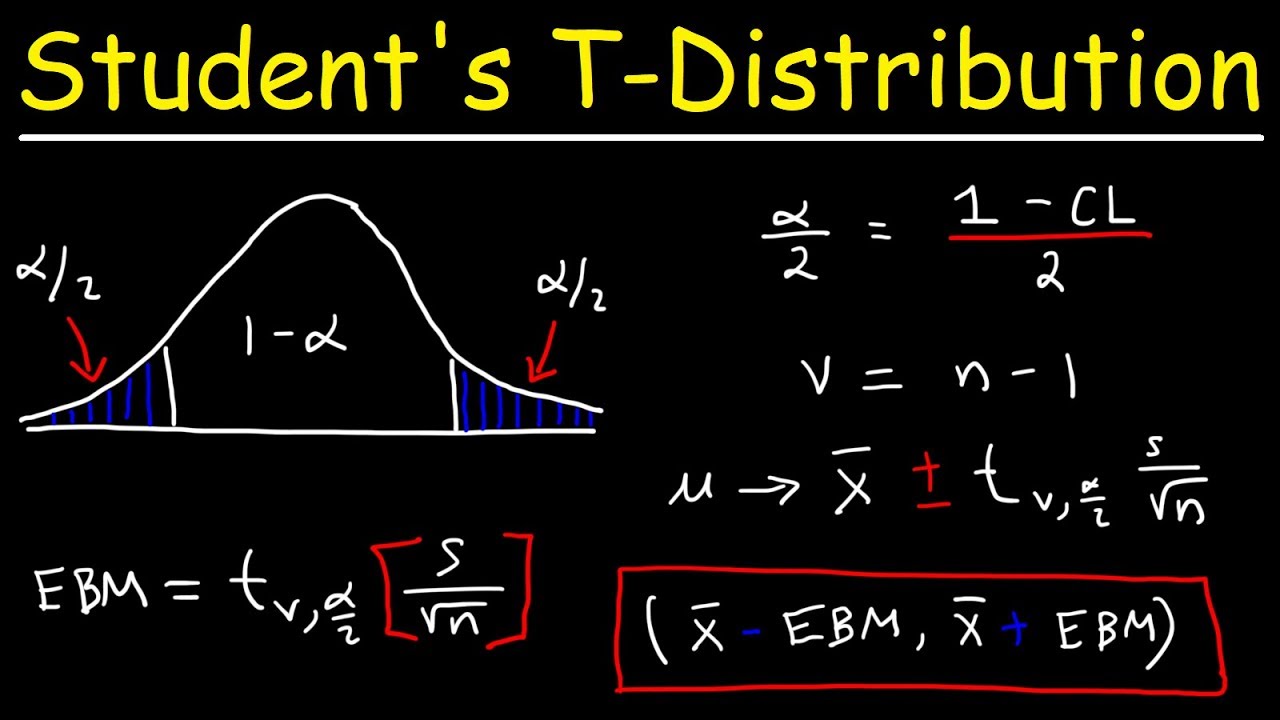
Student's T Distribution - Confidence Intervals & Margin of Error

Sampling distribution of the sample mean 2 | Probability and Statistics | Khan Academy
Standard Error (of the sample mean) | Sampling | Confidence Intervals | Proportions
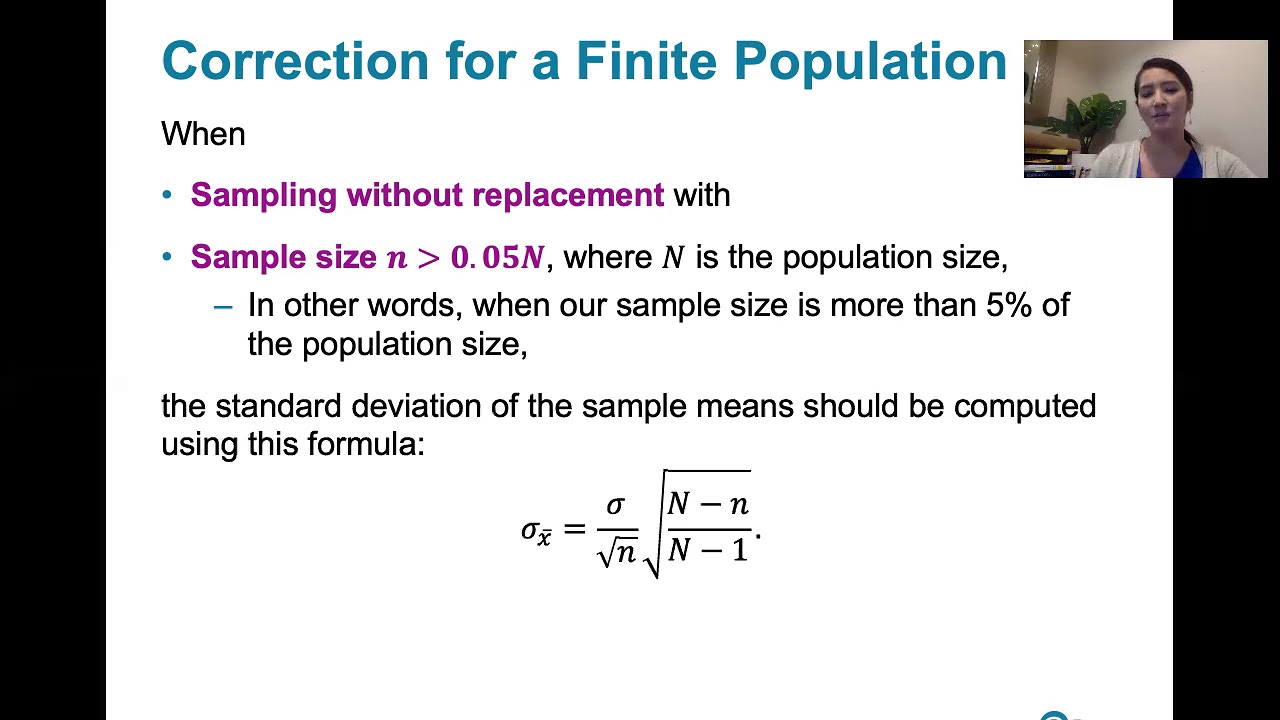
6.4.4 The Central Limit Theorem - Finite Population Correction Factor

Standard error of the mean | Inferential statistics | Probability and Statistics | Khan Academy
5.0 / 5 (0 votes)
Thanks for rating: