Hypothesis Testing Problems - Z Test & T Statistics - One & Two Tailed Tests 2
TLDRThis video covers two problems on hypothesis testing of a population mean. In the first problem, a factory employee tests whether a fluid dispensing machine is actually dispensing less than the specified 80 mLs. Calculating the z-score shows evidence to reject the null hypothesis. The second problem has an engineer testing if a car battery manufacturer's claim of 2+ year lifespan is invalid. The t-test provides strong evidence to reject the null hypothesis at a 99% confidence level, indicating the mean lifespan is under 2 years.
Takeaways
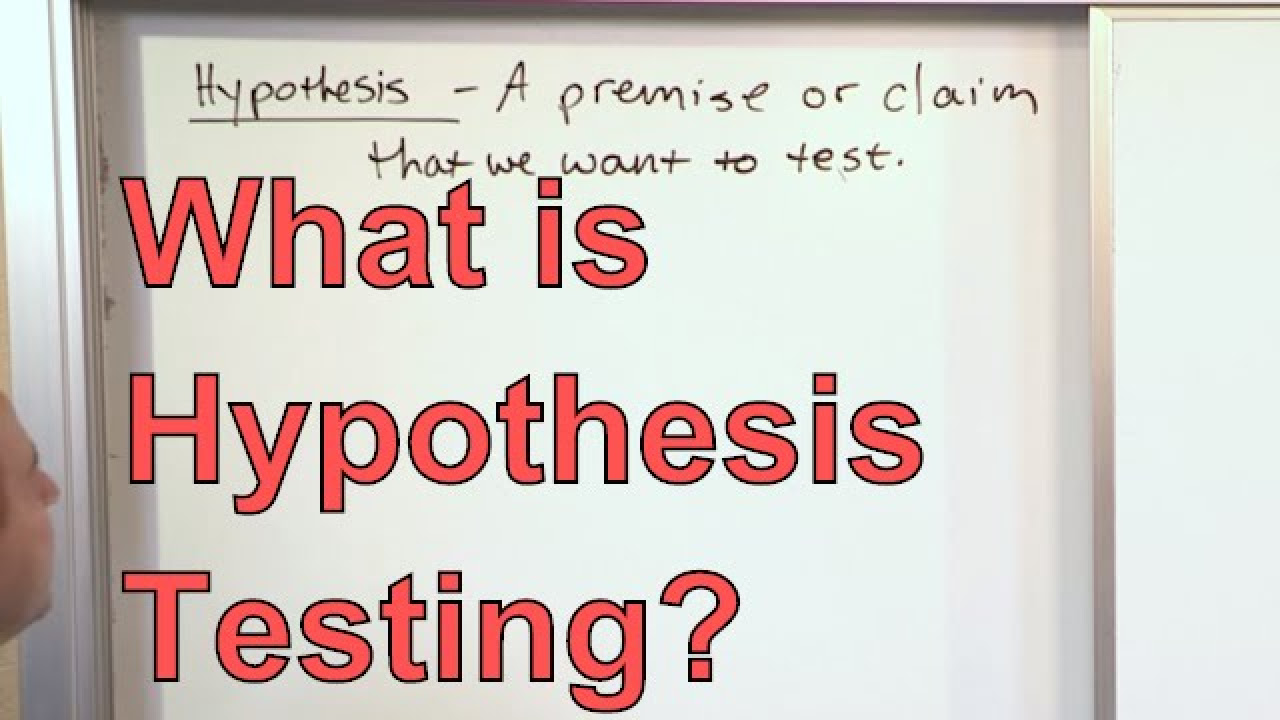
- 📖 The null hypothesis represents the status quo or a statement to be tested for rejection, indicating no change or difference.
- 🔥 The alternative hypothesis is what the researcher seeks to prove, suggesting a change, difference, or effect.
- 🤔 Hypothesis testing involves determining whether to accept or reject the null hypothesis based on sample data.
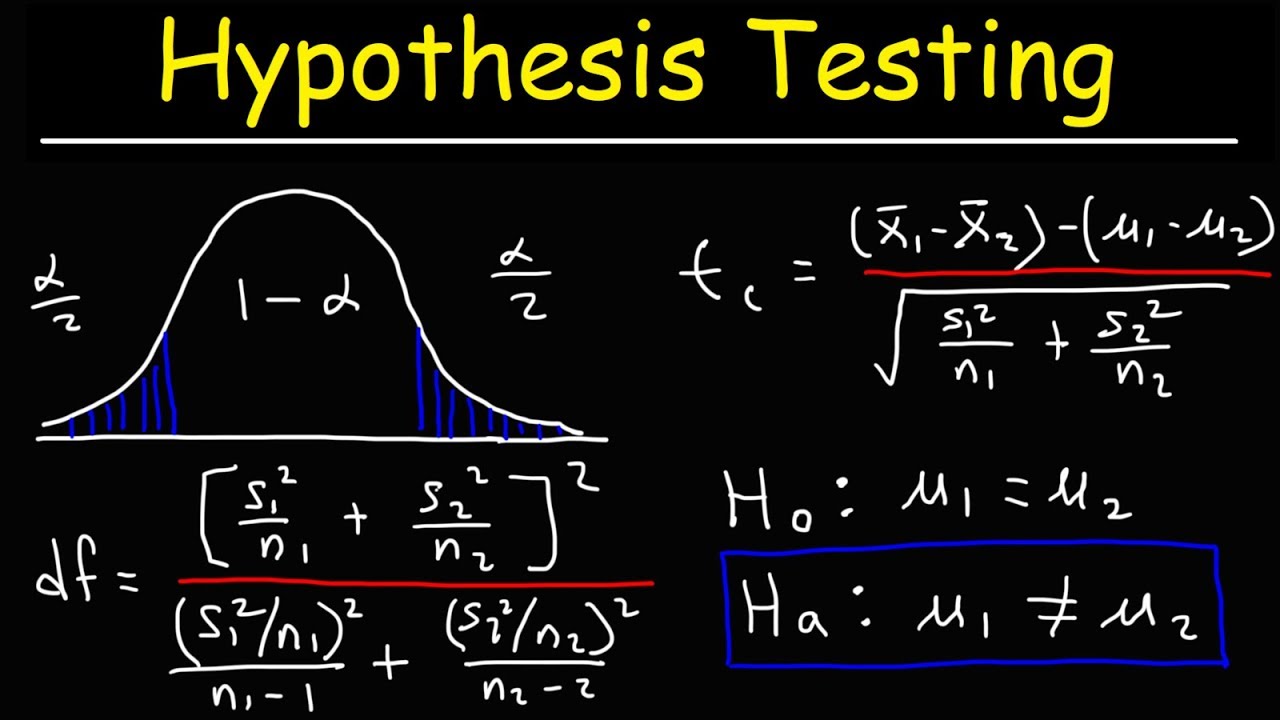
- 📈 A two-tailed test is used when the alternative hypothesis includes values both less than and greater than the null hypothesis value.
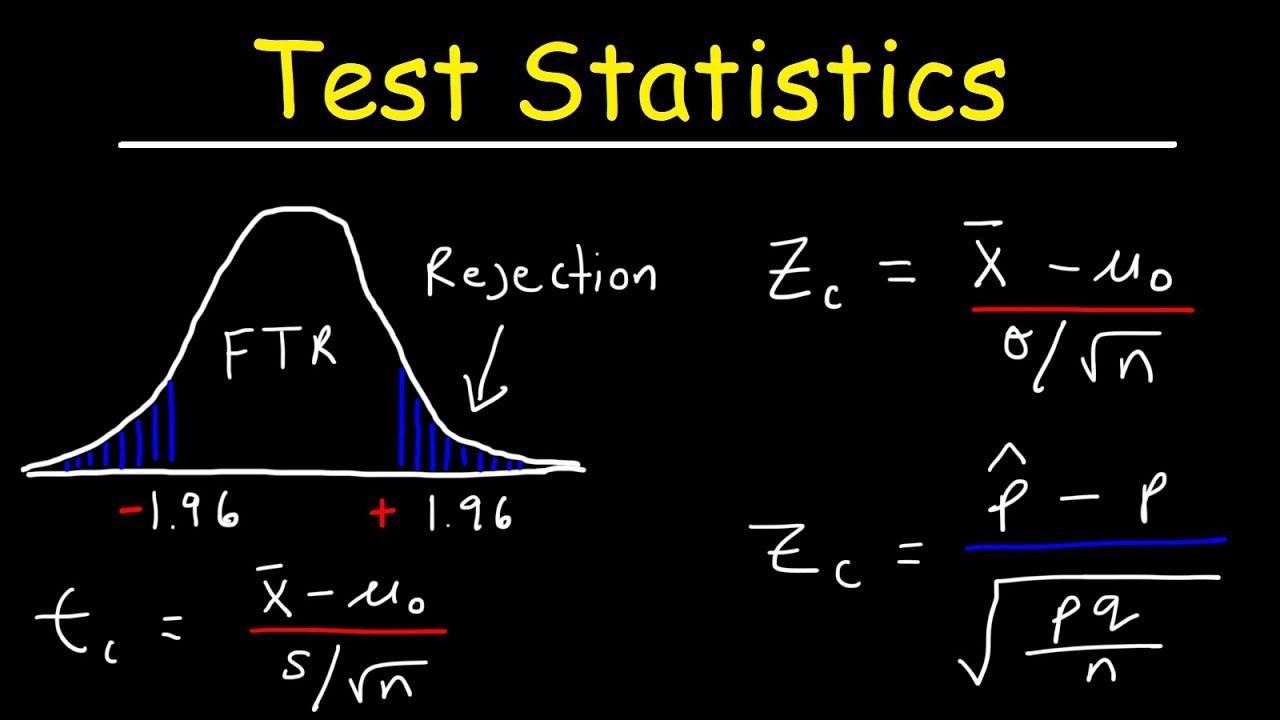
- 💾 The Z-test is appropriate for large sample sizes (n > 30) and when the population standard deviation is known.
- 📉 For small sample sizes (n < 30) or when the population standard deviation is unknown, the T-test is used.
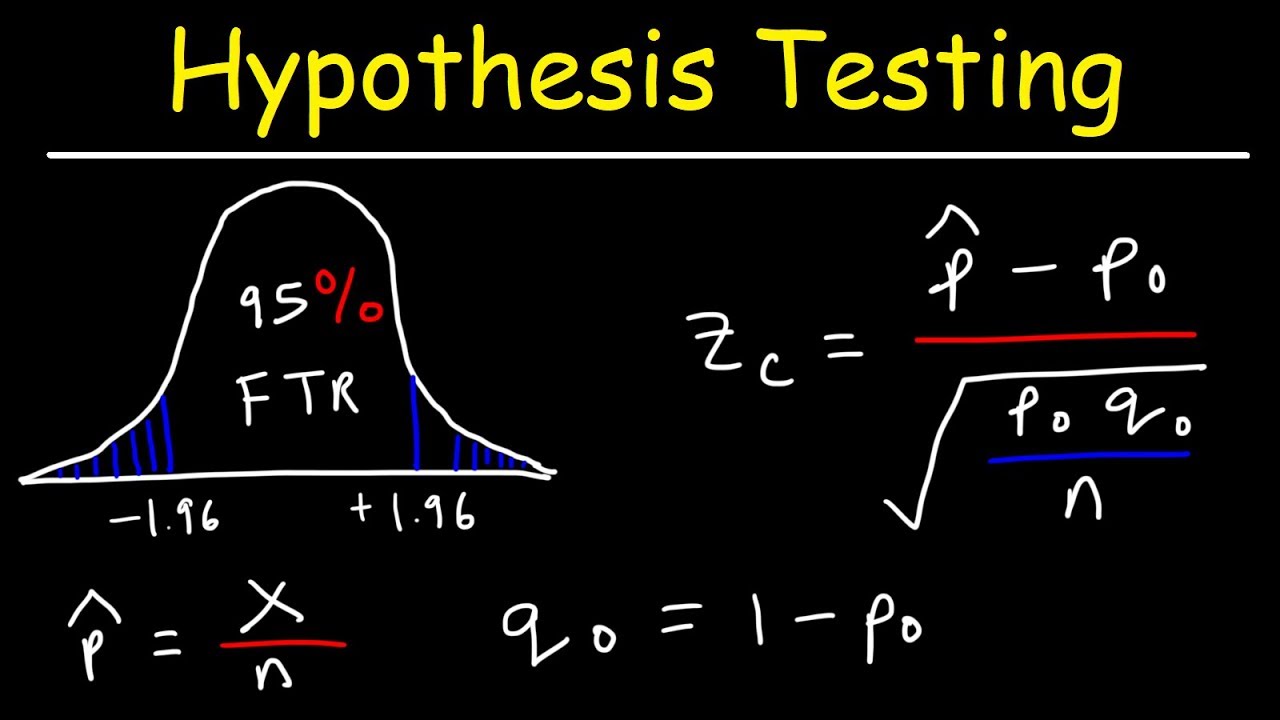
- 📗 Confidence levels (e.g., 95%, 99%) indicate the degree of certainty in the hypothesis test outcome.
- 🔬 Critical values (Z or T) separate the rejection region from the 'fail to reject' region, determining the threshold for the test statistic.
- 📏 Calculating the test statistic (Z or T value) involves using the sample data to assess the strength of evidence against the null hypothesis.
- 🔍 Rejecting the null hypothesis suggests that there is significant evidence to support the alternative hypothesis.
Q & A
What is the first step in hypothesis testing?
-The first step is stating the null and alternative hypotheses. The null hypothesis represents the status quo or existing state, while the alternative hypothesis is what is being tested.
How do you determine if a test is one-tailed or two-tailed?
-If the alternative hypothesis states that the mean does not equal the value in the null hypothesis, it is a two-tailed test. If the alternative states that the mean is greater than or less than the null value, it is a one-tailed test.
When would you use a z-test versus a t-test?
-Use a z-test when the population standard deviation is known or the sample size is greater than 30. Use a t-test when the population standard deviation is unknown and the sample size is less than 30.
What is the critical value in hypothesis testing?
-The critical value separates the rejection region from the fail to reject region. For a certain confidence level, it tells you the z or t value at which you should reject the null hypothesis.
How do you calculate the test statistic?
-The test statistic is calculated by taking the sample mean minus the hypothesized mean in the null hypothesis, divided by the standard error, which is the sample standard deviation over the square root of the sample size.
What does it mean to reject the null hypothesis?
-Rejecting the null hypothesis means that the sample data provides enough evidence to discard the statement made in the null hypothesis at the given confidence level.
How do degrees of freedom relate to sample size?
-Degrees of freedom is equal to sample size minus one. It is used to find critical t-values in the t-distribution table.
What does confidence level signify?
-The confidence level gives the percentage certainty that the conclusion from the hypothesis test is correct.
Why is normal distribution used?
-The normal distribution provides a good approximation for many real-world situations. Also, by the central limit theorem, sample means follow normal distribution as sample size increases.
When would you not perform a hypothesis test?
-Hypothesis testing may not be suitable if there is very limited sample data or if an observational study rather than an experiment was conducted.
Outlines
🔍 Hypothesis Testing on Fluid Dispensation
This section introduces a scenario where an employee suspects a factory machine, designed to dispense 80 milliliters of fluid, is not operating correctly. With 40 samples, the employee finds the average dispensed volume to be 78 milliliters with a standard deviation of 2.5. The null hypothesis (H0) posits the machine dispenses an average of 80 milliliters, while the alternative hypothesis (H1) suggests a deviation from this average. The section proceeds to explain the methodology for conducting a two-tailed test given a 95% confidence level, illustrating the process with a normal distribution and critical z-values to decide on rejecting or accepting H0. The calculated z-score of approximately -5.06, far into the rejection region, leads to the rejection of H0, supporting the employee's belief that the machine is not dispensing the correct amount.
📊 Testing Car Battery Lifespan Hypotheses
This part delves into testing an engineer's hypothesis that a company's car batteries, advertised to last two or more years, actually have a shorter lifespan. With a sample size of 10, the engineer records an average lifespan of 1.8 years and a standard deviation of 0.15. The null hypothesis states the average lifespan is at least two years, while the alternative hypothesis posits it's less than two years. Given the small sample size, a t-test is deemed appropriate over a z-test. With a 99% confidence level leading to a critical t-value of -2.82, the calculated t-value of -4.22 suggests rejecting the null hypothesis. The conclusion indicates strong evidence against the company's claim, favoring the engineer's suspicion of a shorter average lifespan for the batteries.
📝 Conclusion and Additional Resources
The final section concludes the video by summarizing the outcomes of the two hypothesis testing problems presented, emphasizing the practical application of statistical tests in determining the validity of claims regarding machine operation and product lifespan. Additionally, the narrator offers a guide for viewers seeking further clarification on calculating z-scores, directing them to an instructional video by the Organic Chemistry Tutor on YouTube. This gesture underscores the educational intent of the video, providing viewers with resources to deepen their understanding of hypothesis testing and statistical analysis.
Mindmap
Keywords
💡Null Hypothesis
💡Alternative Hypothesis
💡Two-tail Test
💡Confidence Level
💡Z-value
💡Sample Mean
💡Standard Deviation
💡Sample Size
💡T-test
💡Degrees of Freedom
Highlights
Employee believes the average fluid amount is not 80 mL, so he conducts a test
Null hypothesis is the machine dispenses 80 mL on average
Alternative hypothesis is the average amount is not 80 mL
Two-tailed test since alternative is not equal to 80 mL
Calculate z-score to compare to critical value of ±1.96
Calculated z-score is -5.06, which is in rejection region
Reject null hypothesis at 95% confidence level
Null: Mean lifespan ≥ 2 years
Alternative: Mean lifespan < 2 years
Left-tailed test since alternative is less than
Use t-test since n < 30 and population SD unknown
Critical t-value is -2.82 from t-table
Calculated t-value is -4.22, in rejection region
Reject null at 99% confidence level
Enough evidence to reject null hypothesis
Transcripts
Browse More Related Video
Test Statistic For Means and Population Proportions
Hypothesis Testing - Solving Problems With Proportions
Intro to Hypothesis Testing in Statistics - Hypothesis Testing Statistics Problems & Examples
Hypothesis Test vs. Confidence Interval | Statistics Tutorial #15 | MarinStatsLectures
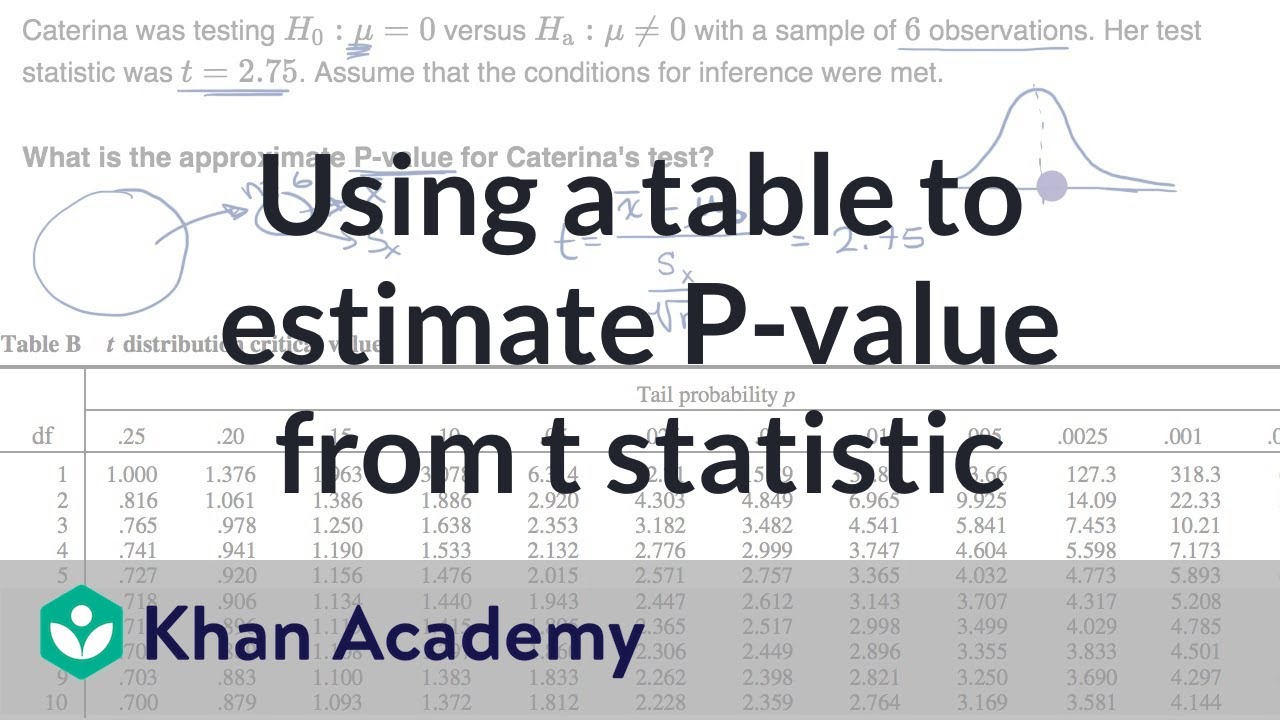
Using a table to estimate P-value from t statistic | AP Statistics | Khan Academy
Hypothesis Testing - Difference of Two Means - Student's -Distribution & Normal Distribution
5.0 / 5 (0 votes)
Thanks for rating: