Empirical Rule of Standard Deviation in Statistics
TLDRThis script delves into the concept of standard deviation and its significance in statistical analysis. It explains how standard deviation measures data spread and introduces the empirical rule, which estimates the percentage of data within one, two, or three standard deviations from the mean in a bell-shaped distribution. The rule of thumb states that approximately 68%, 95%, and 99.7% of data fall within one, two, and three standard deviations, respectively. The script uses the example of newborn baby weights to illustrate how to apply these principles, emphasizing the utility of standard deviation in summarizing and drawing conclusions from data sets.
Takeaways
- 📊 Standard deviation is crucial for understanding the distribution of data, indicating where a significant portion of the data lies relative to the mean.
- 📚 The empirical rule, also known as the 68-95-99.7 rule, provides a way to estimate the percentage of data within a certain number of standard deviations from the mean.
- 🔍 Bell-shaped data, or normal distribution, is common and is the basis for applying the empirical rule, which does not apply to all data distributions.
- 📉 In a bell-shaped distribution, the mean and the mode coincide, and the data is symmetrically distributed around the mean, forming a peak.
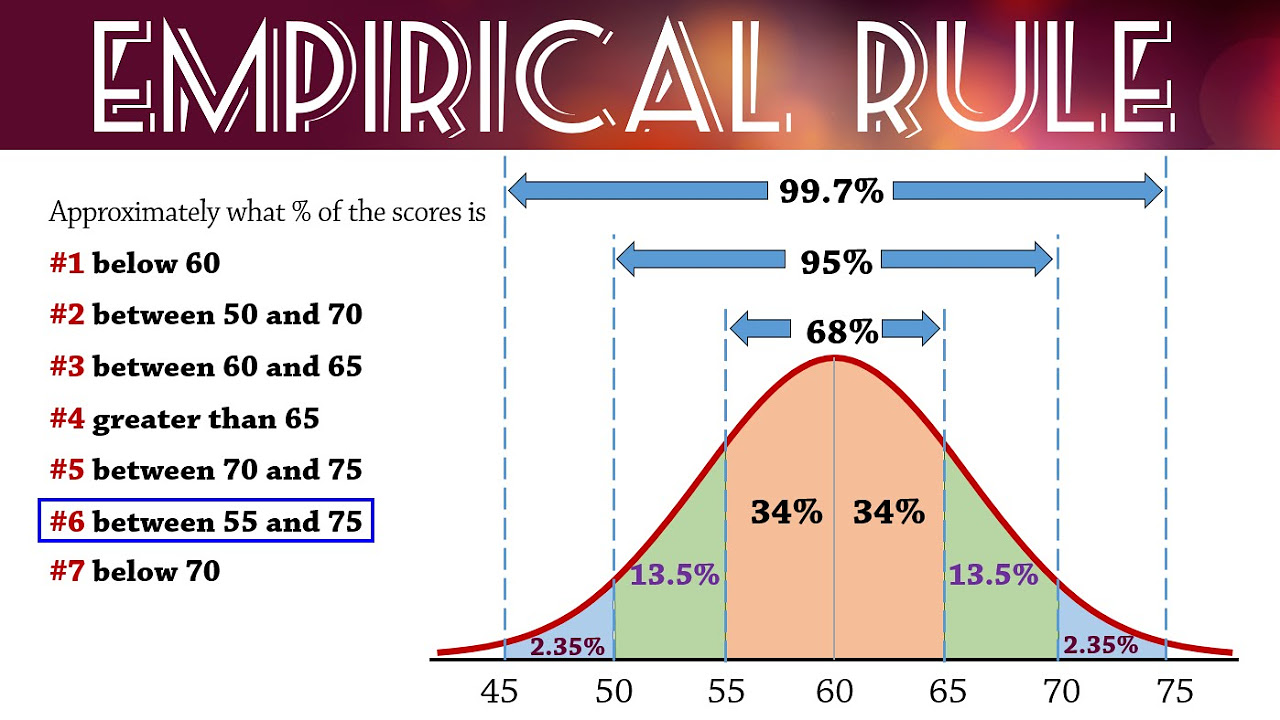
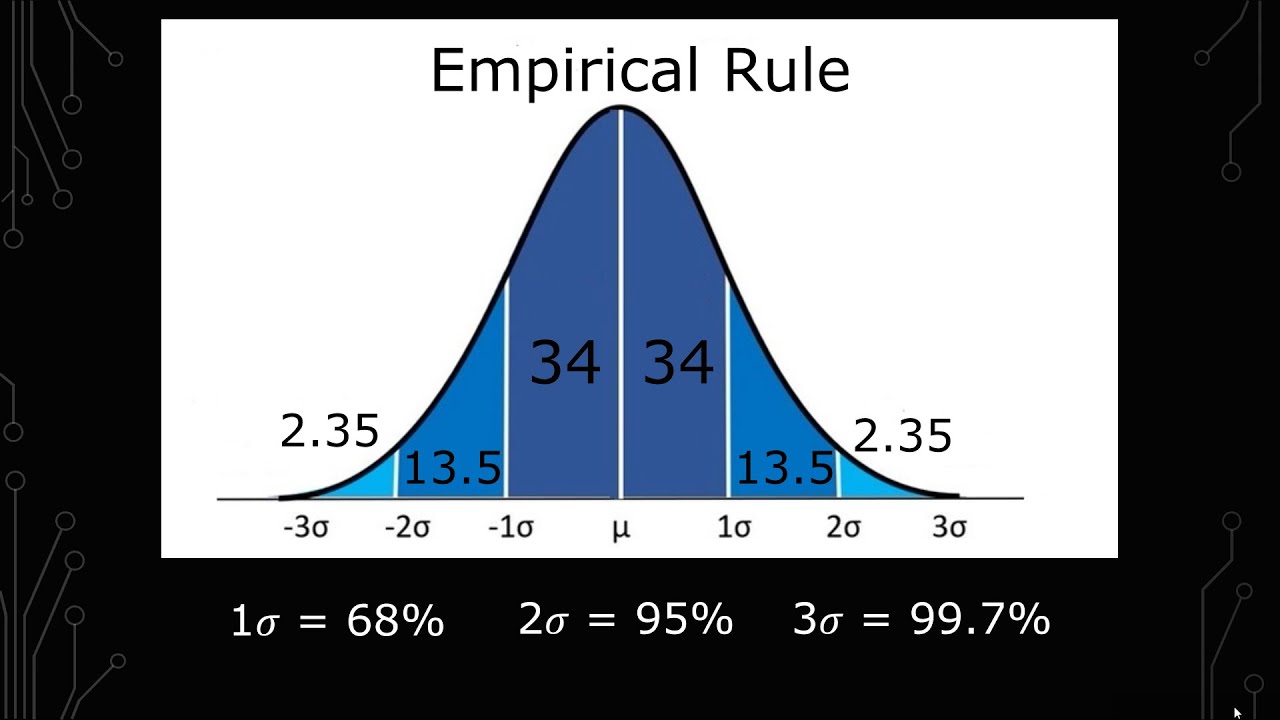
- 🔢 Approximately 68% of data points fall within one standard deviation (one sigma) of the mean in a normal distribution.
- 📈 About 95% of data points are within two standard deviations (two sigma) of the mean, covering a broader range of the distribution.
- 📊 Almost all data points, 99.7%, lie within three standard deviations (three sigma) of the mean, indicating a very small chance of data falling outside this range.
- 📘 The empirical rule helps in making inferences about data sets, especially when the shape of the distribution is known to be bell-shaped.
- 📝 When given the mean and standard deviation, one can use the empirical rule to estimate the distribution of data points without having to plot the entire set.
- 📋 The script provides an example using the weight of newborn babies to illustrate how to apply the empirical rule to find the percentage of data within a specific range.
- 🔑 Understanding the empirical rule and standard deviation is key to summarizing and making conclusions about data sets, especially in statistics.
Q & A
What is the significance of standard deviation in understanding data?
-Standard deviation is significant because it indicates the amount of variation or dispersion in a set of values. It tells us that a good chunk of the data should lie within one standard deviation of the mean, which is a measure of central tendency.
What does it mean for data to be bell-shaped?
-Bell-shaped data refers to a distribution that is symmetrical about the mean, with the majority of data points concentrated around the mean and fewer data points as you move further away from the mean. It resembles the shape of a bell curve.
Why is the empirical rule important in statistics?
-The empirical rule is important because it provides a quick way to estimate the proportion of data that falls within a certain number of standard deviations from the mean, which helps in summarizing and making inferences about the data.
What percentage of data is expected to fall within one standard deviation of the mean according to the empirical rule?
-According to the empirical rule, approximately 68% of the data is expected to fall within one standard deviation of the mean.
How does the percentage of data within two standard deviations of the mean compare to that within one standard deviation?
-The percentage of data within two standard deviations of the mean is higher, approximately 95%, indicating that a larger proportion of the data is closer to the mean when considering a broader range.
What is the significance of the 99.7% rule in the context of the empirical rule?
-The 99.7% rule states that almost all of the data, specifically 99.7%, falls within three standard deviations of the mean. This is significant as it shows that extreme values are very rare in a normally distributed dataset.
Can the empirical rule be applied to any type of data distribution?
-No, the empirical rule is specifically applicable to bell-shaped or normally distributed data. It does not apply to data that is not symmetrical or does not follow a normal distribution.
How can you calculate the range of one standard deviation above and below the mean?
-To calculate the range of one standard deviation above and below the mean, you add the standard deviation to the mean to find the upper bound and subtract the standard deviation from the mean to find the lower bound.
What does it imply if a classroom's grade distribution has a small standard deviation?
-A small standard deviation in a classroom's grade distribution implies that the students' grades are closely packed around the mean, indicating less variability in student performance.
How can you determine if a given range of values corresponds to one, two, or three standard deviations from the mean?
-You can determine the number of standard deviations a range corresponds to by calculating the difference between the endpoints of the range and the mean, then dividing by the standard deviation. The result will indicate how many standard deviations the range spans.
In the context of the newborn baby weight example, what percentage of babies are expected to weigh between 2183 grams and 4467 grams?
-In the context of the newborn baby weight example, where the data is bell-shaped with a mean of 3325 grams and a standard deviation of 571 grams, approximately 95% of babies are expected to weigh between 2183 grams and 4467 grams, as this range corresponds to two standard deviations from the mean.
Outlines
📊 Understanding Standard Deviation and Bell-Shaped Data
This paragraph introduces the concept of standard deviation as a measure of data dispersion, particularly in bell-shaped distributions. It explains that a significant portion of data typically falls within one standard deviation from the mean. The speaker emphasizes the importance of standard deviation in understanding data distribution, using the analogy of student grades in a classroom. The empirical rule is mentioned as a tool to quantify the spread of data, and the paragraph sets the stage for a deeper dive into the specifics of this rule.
📚 The Empirical Rule and Data Distribution
The speaker elaborates on the empirical rule, a statistical tool that helps in understanding the distribution of data around the mean within one, two, or three standard deviations. It explains that approximately 68% of the data lies within one standard deviation of the mean, 95% within two, and 99.7% within three standard deviations. This paragraph also clarifies that these percentages are rule-of-thumb estimates that apply specifically to bell-shaped data, which is common in many real-world scenarios.
📉 Visualizing Data Distribution with Bell Curves
This paragraph uses the visual representation of bell curves to explain the concept of standard deviation and its empirical rule. It describes how the shape of the bell curve indicates the spread of data, with a peak at the mean value. The speaker illustrates how the data is more densely packed around the mean with a smaller standard deviation and more spread out with a larger standard deviation. The paragraph reinforces the idea that the empirical rule helps in estimating the percentage of data points within certain ranges of the mean.
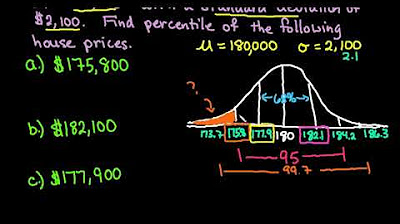
🔢 Applying the Empirical Rule to Newborn Weight Data
The speaker applies the empirical rule to a specific example involving the weight of newborn babies, which is described as a bell-shaped distribution with a mean weight and standard deviation provided. The paragraph walks through the calculation of one and two standard deviations from the mean and relates these calculations to the given weight ranges in the problem. It concludes that 95% of newborns weigh between these two calculated ranges, demonstrating how the empirical rule can be used to make predictions about data distribution.
📈 Summarizing the Importance of Standard Deviation
In the concluding paragraph, the speaker summarizes the importance of standard deviation and the empirical rule in understanding and summarizing data. It reiterates the percentages of data that fall within one, two, and three standard deviations from the mean, emphasizing their significance in statistical analysis. The speaker encourages further practice with these concepts and directs learners to additional resources for learning more about these topics.
Mindmap
Keywords
💡Standard Deviation
💡Bell-shaped Data
💡Empirical Rule
💡Mean
💡Data Distribution
💡Sigma (Σ)
💡Percentage of Data
💡Newborn Babies' Weight
💡Symmetrical
💡Graphical Representation
Highlights
The standard deviation is crucial for understanding the distribution of data around the mean.
Approximately 68% of data lies within one standard deviation of the mean.
The concept of 'most of the data' is quantified using the standard deviation.
Bell-shaped data is common and is symmetrical about the mean, which is essential for applying the empirical rule.
The empirical rule, or the 68-95-99.7 rule, provides a way to estimate data distribution based on standard deviation.
95% of data falls within two standard deviations of the mean.
99.7% of data is within three standard deviations of the mean, leaving a small percentage of outliers.
The empirical rule applies only to bell-shaped data, which is a common occurrence in real-world data sets.
Understanding the standard deviation helps in making informed conclusions about data distribution.
The spread of data can be visualized graphically as a bell curve, with the mean at the peak.
The height of the bell curve represents the frequency of data points at a particular value.
A smaller standard deviation indicates that data is tightly packed around the mean.
A larger standard deviation suggests greater variation in the data set.
The empirical rule is a rule of thumb that simplifies statistical theory into practical use.
Using the empirical rule, one can estimate the percentage of a population within a certain range of the mean.
The example of newborn baby weights demonstrates the application of the empirical rule in a real-world context.
Knowing the mean and standard deviation allows for quick estimation of data distribution percentages.
The empirical rule provides a foundation for further statistical analysis and understanding of data sets.
Transcripts
Browse More Related Video
Empirical Rule (68-95-99.7) for Normal Distributions

Statistics Lecture 3.3: Finding the Standard Deviation of a Data Set

What is a Bell Curve or Normal Curve Explained?
How to Use the Empirical Rule with Examples
Empirical Rule 68-95-99.7 Rule to Find Percentile

What Is And How To Use Chebyshev's Theorem And The Empirical Rule Formula In Statistics Explained
5.0 / 5 (0 votes)
Thanks for rating: