Standard Deviation and Coefficient of Variation
TLDRThe video script explains the concept and calculation of the coefficient of variation (CV), a statistical measure that indicates the degree of variation in relation to the mean. It distinguishes between sample and population CV, emphasizing the CV's utility in comparing data sets with different units. The script provides formulas for calculating standard deviation for both sample and population, followed by a step-by-step example using test scores to demonstrate how to compute mean, standard deviation, and ultimately the CV, highlighting its expression as a percentage. The example illustrates how CV can reveal the relative variability between different groups, such as test A with 4.7% and test B with 14.3% CV, indicating greater variation in test B.
Takeaways
- 📐 The coefficient of variation (CV) is calculated by dividing the standard deviation by the mean and multiplying by 100% for both samples and populations.
- 🔍 The CV is used to compare the dispersion of data across different datasets, as it is unitless and thus not affected by the scale of measurement.
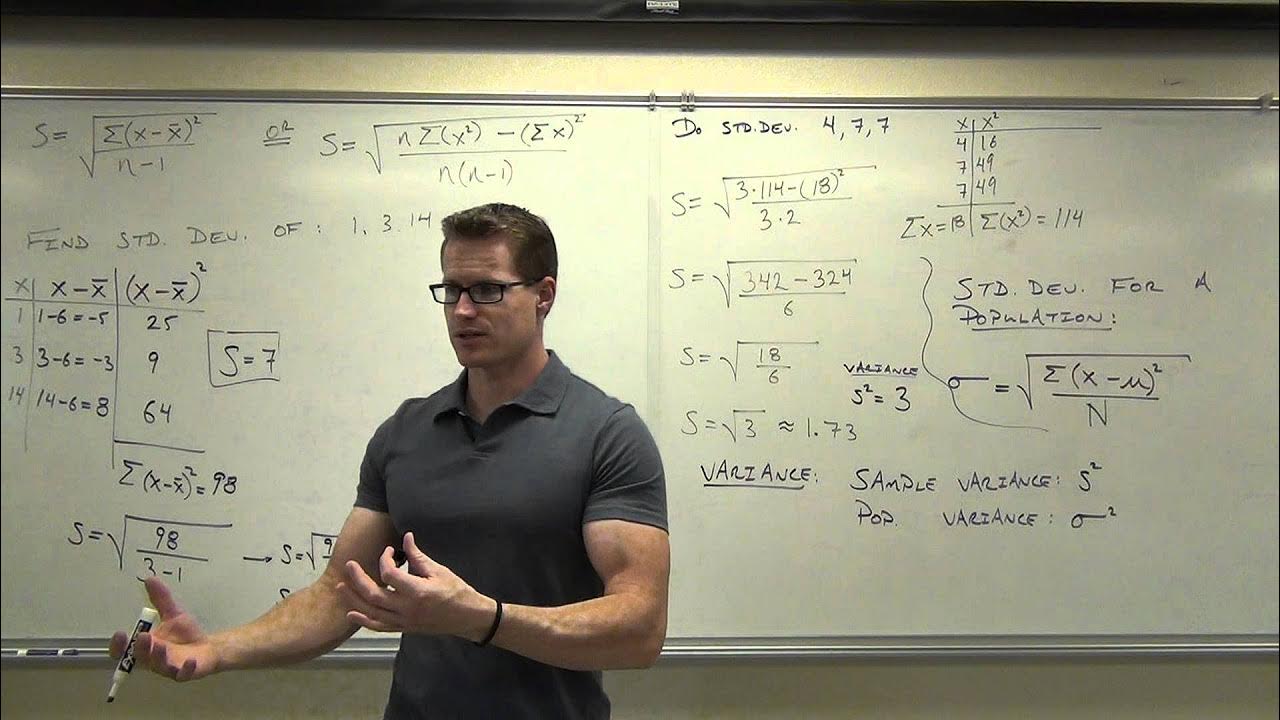
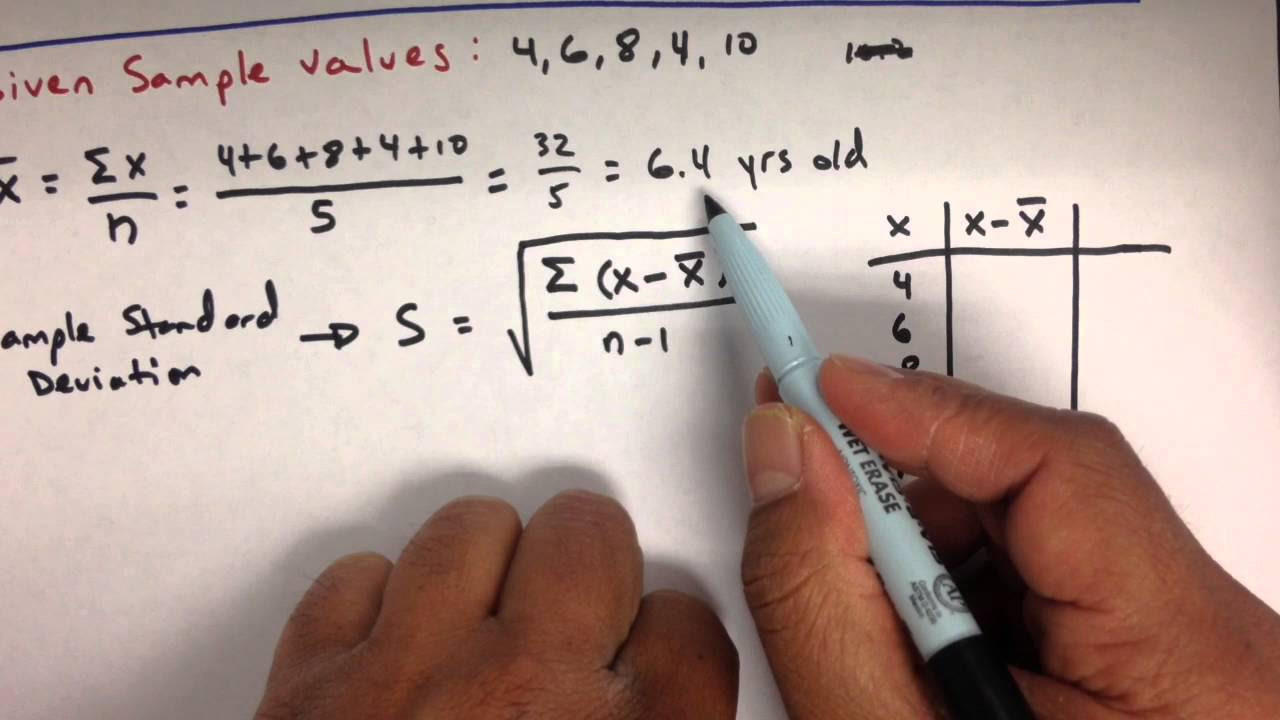
- 📊 To calculate the sample standard deviation, you sum the squared differences between each data point and the sample mean, then take the square root of this sum divided by the sample size minus one.
- 📈 For a population standard deviation, the process is similar, but the sum of squared differences is divided by the population size (N).
- 📝 The script provides a step-by-step example of calculating the mean, standard deviation, and CV for two different tests (Test A and Test B) with given scores.
- 🧮 The mean for Test A is calculated as 83.8 and for Test B as 77.8 by summing the scores and dividing by the number of students (5).
- ⚖️ The standard deviation for Test A is calculated using the formula, resulting in approximately 3.96, and for Test B, it is approximately 14.3.
- 📊 The CV for Test A is found to be around 4.7%, indicating relatively low variation, while Test B has a CV of around 14.3%, indicating higher variation.
- 🔢 The script emphasizes that the CV is a useful metric for comparing the relative variability of two or more datasets, regardless of their units.
- 📋 The process of calculating the CV involves understanding and applying statistical formulas for mean, standard deviation, and the CV itself.
Q & A
What is the coefficient of variation?
-The coefficient of variation (CV) is a measure of relative variability that represents the ratio of the standard deviation to the mean. It is often expressed as a percentage and is used to compare the dispersion of two or more data sets.
How is the coefficient of variation calculated for a sample?
-For a sample, the coefficient of variation is calculated as the sample standard deviation divided by the sample mean, multiplied by 100%.
What is the formula for calculating the coefficient of variation for a population?
-For a population, the coefficient of variation is calculated as the population standard deviation divided by the population mean, multiplied by 100%.
Why is the coefficient of variation useful when comparing different data sets?
-The coefficient of variation is useful for comparing different data sets because it is unitless, which means that the units cancel out, allowing for a direct comparison of variability across different units of measurement.
What is the formula for calculating the sample standard deviation?
-The sample standard deviation is calculated as the square root of the sum of the squared differences between each data point and the sample mean, divided by the sample size minus one (n-1).
How is the population standard deviation different from the sample standard deviation formula?
-The population standard deviation is calculated as the square root of the sum of the squared differences between each data point and the population mean, divided by the population size (N), not by N-1 as in the sample standard deviation.
What does a coefficient of variation of 20% imply about the data set?
-A coefficient of variation of 20% implies that the standard deviation is 20% of the mean, indicating the relative variability of the data points around the mean.
What is the purpose of calculating the mean before calculating the standard deviation?
-Calculating the mean before the standard deviation is necessary because the mean serves as the central value from which deviations are measured to calculate the standard deviation.
Can you provide an example of how to calculate the coefficient of variation using the data provided in the script?
-Sure. For Test A, the mean is 83.8 and the standard deviation is calculated to be approximately 3.96. The coefficient of variation is then (3.96 / 83.8) * 100%, which equals approximately 4.7%.
What does a higher coefficient of variation indicate about the data set compared to another?
-A higher coefficient of variation indicates that the data set has greater relative variability or dispersion compared to another data set with a lower coefficient of variation.
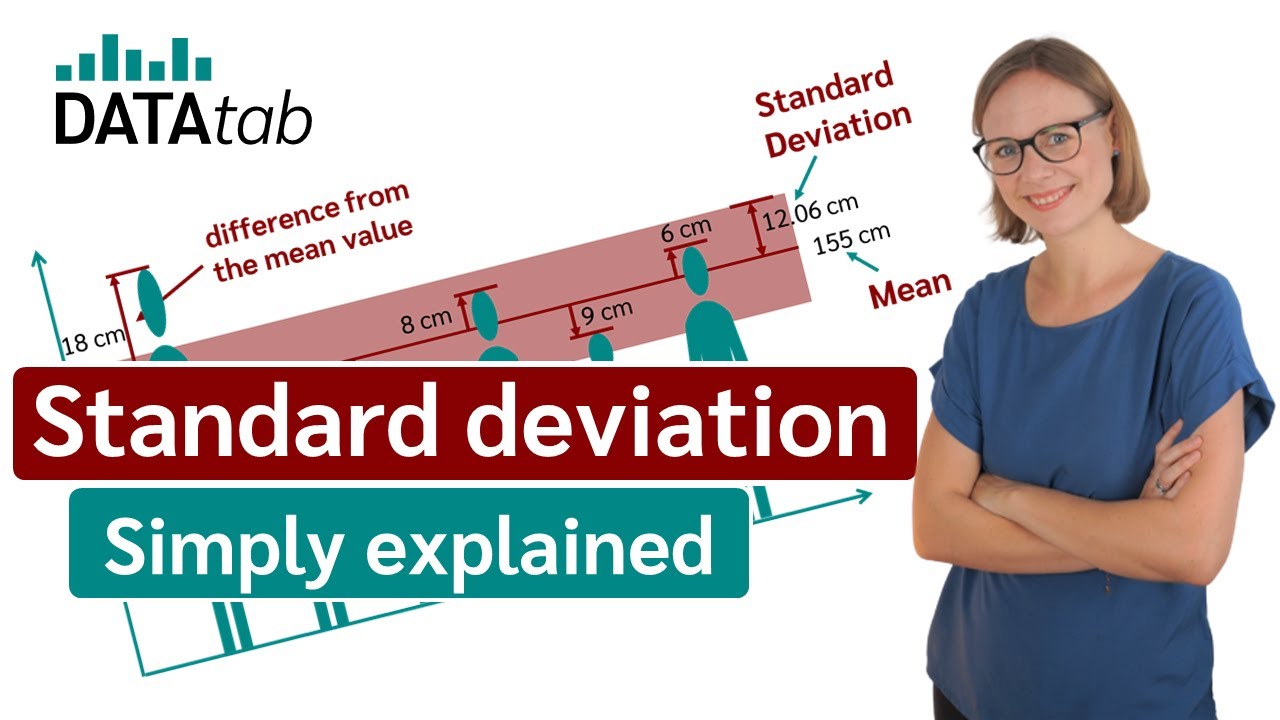
How does the coefficient of variation help in understanding the dispersion of data around the mean?
-The coefficient of variation helps in understanding the dispersion of data around the mean by providing a measure of the standard deviation relative to the mean, which can be compared across different data sets regardless of their units of measurement.
Outlines
📊 Understanding the Coefficient of Variation
The first paragraph introduces the concept of the coefficient of variation (CV), which is a measure of relative variability. It explains how to calculate the CV for both a sample and a population by dividing the standard deviation by the mean and then multiplying by 100%. The CV is highlighted as a useful tool for comparing the dispersion of different datasets, as it is unitless and thus not affected by the scale of measurement. The paragraph also outlines the formulas for calculating the standard deviation for both samples and populations, which are prerequisites for determining the CV. An example problem involving two test scores is introduced to illustrate the calculation process.
🧮 Calculating the Sample Mean and Standard Deviation
This paragraph delves into the process of calculating the sample mean and standard deviation for two different tests, A and B. The sample mean is found by summing all scores and dividing by the number of students. For test A, the mean is calculated to be 83.8, and for test B, it is 77.8. The standard deviation is then calculated by taking the square root of the sum of the squared differences between each data point and the mean, divided by the sample size minus one. The paragraph provides step-by-step calculations for both tests, emphasizing the importance of squaring the differences to ensure positive results and the use of the sample size minus one in the denominator to account for bias in small samples.
🔢 Determining the Coefficient of Variation for Two Data Sets
The final paragraph concludes the example problem by calculating the coefficient of variation for both test A and test B. The standard deviation for each test is divided by its respective mean and then multiplied by 100% to express the CV as a percentage. For test A, the CV is found to be approximately 4.7%, while for test B, it is 14.3%. This comparison illustrates that test B has a higher degree of variation than test A, as indicated by the higher CV. The paragraph reinforces the concept that the CV is a ratio between the standard deviation and the mean, and it can be expressed as a percentage to provide a clear measure of relative variability.
Mindmap
Keywords
💡Coefficient of Variation
💡Sample Standard Deviation
💡Sample Mean
💡Population Standard Deviation
💡Dispersion
💡Units
💡Square Differences
💡Sample Size
💡Population Size
💡Ratio
Highlights
The coefficient of variation is calculated by dividing the sample standard deviation by the sample mean, then multiplying by 100%.
For a population, the coefficient of variation is the population standard deviation divided by the population mean, times 100%.
Coefficient of variation represents the ratio between standard deviation and mean.
A coefficient of variation of 20% means the standard deviation is 20% of the mean.
Coefficient of variation is useful for comparing dispersion across different data sets.
It is unitless, making it ideal for comparing data sets with different units.
To calculate the coefficient of variation, you must first calculate the standard deviation.
Sample standard deviation formula involves the square root of the sum of square differences from the sample mean, divided by n-1.
Population standard deviation formula is similar but divided by the population size N.
Example problem involves calculating the coefficient of variation for two data sets from test scores.
Sample mean for test A is calculated to be 83.8.
Sample mean for test B is calculated to be 77.8.
Sample standard deviation for test A is calculated using the formula and found to be approximately 3.96.
Sample standard deviation for test B is calculated and found to be approximately 14.39.
Coefficient of variation for test A is calculated to be 4.7%.
Coefficient of variation for test B is calculated to be 14.3%.
Test B has more variation than test A, as shown by the higher coefficient of variation.
The coefficient of variation is a percentage that shows the ratio of standard deviation to mean.
Transcripts
Browse More Related Video

Variance, Standard Deviation, Coefficient of Variation
Statistics Lecture 3.3: Finding the Standard Deviation of a Data Set
Measures of Dispersion (Ungrouped Data) | Basic Statistics

Intro to Standard Z-Score & Normal Distribution in Statistics
Variance and Standard Deviation: Sample and Population Practice Statistics Problems
Standard deviation (simply explained)
5.0 / 5 (0 votes)
Thanks for rating: