What Is And How To Use Chebyshev's Theorem And The Empirical Rule Formula In Statistics Explained
TLDRThis video explains the concepts of variance and standard deviation, highlighting their role in measuring data dispersion. It introduces Chebyshev’s theorem, which determines the minimum percentage of data within k standard deviations from the mean for any distribution, and the empirical rule, applicable to normal distributions, that specifies the percentage of data within 1, 2, and 3 standard deviations from the mean. Examples with specific data sets are provided to illustrate these principles. The video aims to enhance understanding of these statistical tools and their applications.
Takeaways
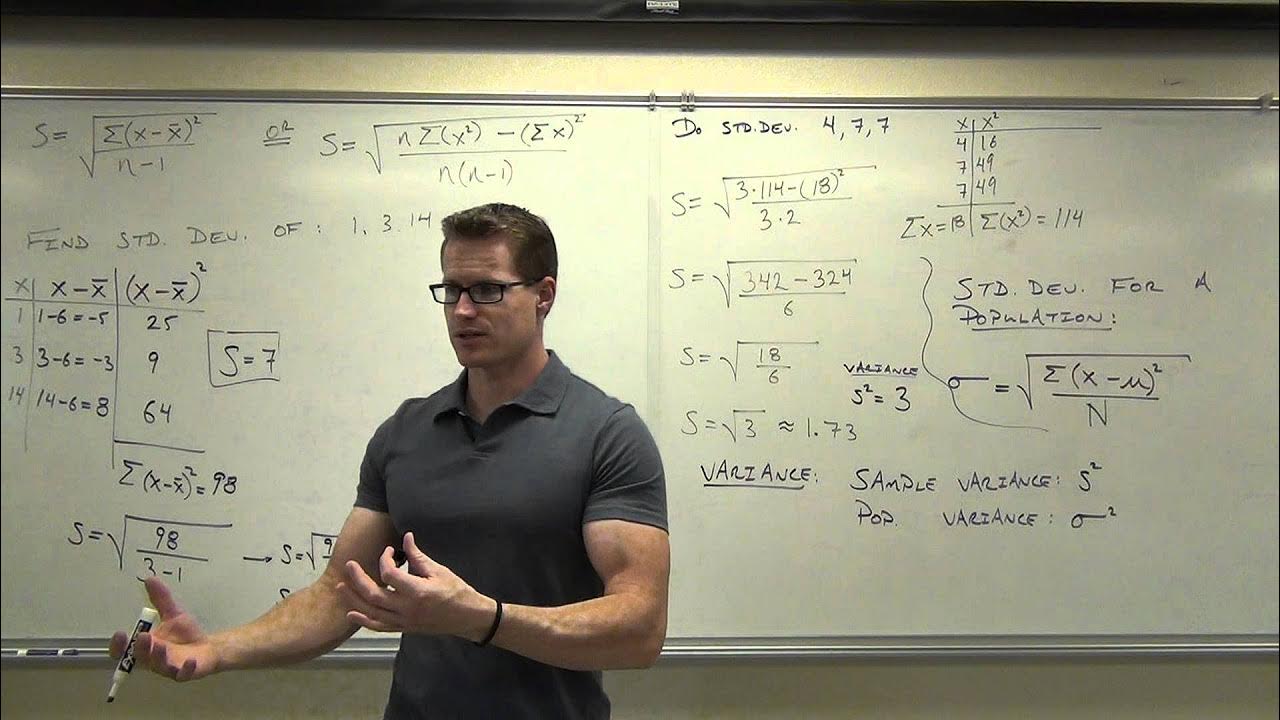
- 📊 Variance and standard deviation are measures of the spread or dispersion of a variable in a dataset.
- 📉 A smaller standard deviation indicates that the data points are less spread out compared to a variable with a larger standard deviation.
- 📚 Two variables can have the same mean but differ in their standard deviation, affecting the spread of their data.
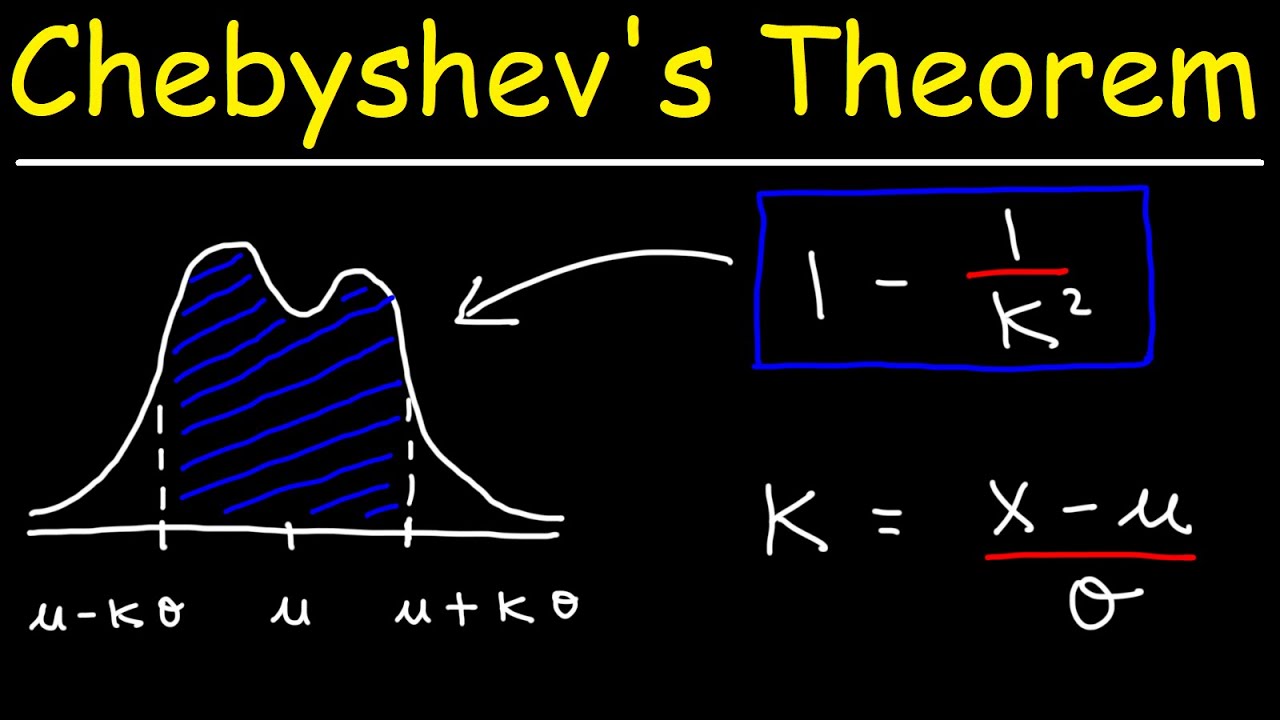
- 🧩 Chebyshev's theorem provides a mathematical formula to estimate the percentage of values within k standard deviations of the mean for any distribution.
- 🔢 Chebyshev's theorem can be applied by plugging in any number greater than one for k to find the minimum percentage of data within k standard deviations.
- 📈 For example, with k=2, at least 75% of data values lie within 2 standard deviations of the mean, and with k=3, at least 88.89% lie within 3 standard deviations.
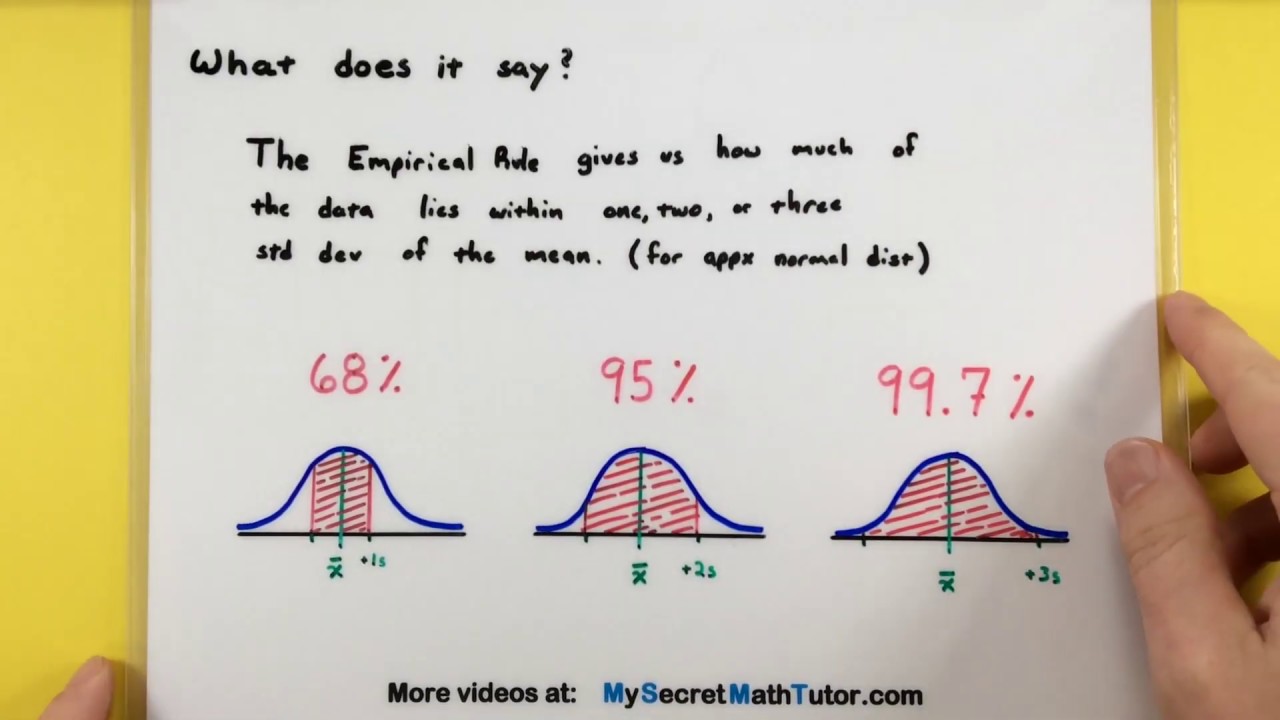
- 📚 The empirical rule is specific to bell-shaped or normal distributions and provides approximate percentages of data within 1, 2, and 3 standard deviations of the mean.
- 📊 The empirical rule states that approximately 68% of data values lie within 1 standard deviation, 95% within 2, and 99.7% within 3 standard deviations of the mean in a normal distribution.
- 📐 An example with a mean of 88 and a standard deviation of 11 illustrates the empirical rule, showing the approximate ranges for 68%, 95%, and 99.7% of data values.
- 🔑 It's important to note that Chebyshev's theorem applies to any distribution shape, while the empirical rule is specific to normal distributions.
Q & A
What do variance and standard deviation measure in a dataset?
-Variance and standard deviation measure the spread or dispersion of a variable within a dataset. A smaller standard deviation indicates that the data points are less spread out and more closely clustered around the mean.
Can two variables have the same mean but different standard deviations?
-Yes, two variables can have the same mean but different standard deviations, indicating that the data for one variable is more spread out than the other.
What is Chebyshev’s theorem and what does it state?
-Chebyshev’s theorem is a statistical principle stating that at least 1 - 1/k^2 of the data values in a set will lie within k standard deviations of the mean, where k is any number greater than one.
How does Chebyshev’s theorem apply to any distribution shape?
-Chebyshev’s theorem can be applied to any distribution shape because it does not assume any specific form of the distribution, making it a general rule for data analysis.
What percentage of data values are expected to lie within 2 standard deviations of the mean according to Chebyshev’s theorem?
-According to Chebyshev’s theorem, at least 75% of the data values are expected to lie within 2 standard deviations of the mean.
How does the empirical rule differ from Chebyshev’s theorem?
-The empirical rule specifically applies to bell-shaped or normal distributions and provides more precise percentages (approximately 68%, 95%, and 99.7%) for data values within 1, 2, and 3 standard deviations of the mean, respectively.
What is the significance of the empirical rule in data analysis?
-The empirical rule provides a quick and easy way to estimate the proportion of data within a certain range for normal distributions, which is useful for making predictions and understanding data distribution.
What is the difference between the empirical rule and Chebyshev’s theorem in terms of the percentage of data within 3 standard deviations of the mean?
-The empirical rule estimates approximately 99.7% of data within 3 standard deviations for a normal distribution, while Chebyshev’s theorem guarantees at least 88.89% for any distribution shape.
How can Chebyshev’s theorem be used to analyze a dataset with a mean of 122 and a standard deviation of 12?
-Using Chebyshev’s theorem, you can calculate that at least 75% of the values in the dataset will lie between 98 and 146 (2 standard deviations from the mean), and at least 88.89% will lie between 86 and 158 (3 standard deviations from the mean).
What does the video script suggest about the relationship between the mean and standard deviation in understanding data distribution?
-The video script suggests that while the mean provides the central tendency of the data, the standard deviation is crucial for understanding the spread and dispersion of the data points around the mean.
Outlines
📊 Understanding Variance and Standard Deviation
This paragraph explains the concepts of variance and standard deviation, which are key to understanding the spread of a variable's data. It illustrates how two variables with the same mean can differ in spread, with the one having a smaller standard deviation being less dispersed. The Chebyshev's theorem is introduced, which provides a mathematical guarantee on the proportion of data points within 'k' standard deviations from the mean, regardless of the distribution's shape. An example with a mean of 122 and a standard deviation of 12 is used to demonstrate how to calculate the data points within 1, 2, and 3 standard deviations, emphasizing that at least 75% and 88.89% of the data will fall within these ranges respectively.
Mindmap
Keywords
💡Variance
💡Standard Deviation
💡Chebyshev’s Theorem
💡Mean
💡Data Set
💡Spread
💡Empirical Rule
💡Bell-Shaped Distribution
💡Percentage
💡Deviation
Highlights
Variance and standard deviation are key measures to understand the spread or dispersion of a variable.
A variable with a smaller standard deviation is less spread out compared to another with the same mean but larger standard deviation.
Chebyshev’s theorem provides a formula to estimate the percentage of data within k standard deviations of the mean.
The theorem applies to any distribution shape, offering a universal method for data analysis.
At least 75% of data values lie within 2 standard deviations from the mean according to Chebyshev’s theorem.
At least 88.89% of data values lie within 3 standard deviations from the mean.
The empirical rule is specific to bell-shaped or normal distributions.
Approximately 68% of data values lie within 1 standard deviation of the mean in a normal distribution.
Approximately 95% of data values lie within 2 standard deviations of the mean in a normal distribution.
Approximately 99.7% of data values lie within 3 standard deviations of the mean in a normal distribution.
The empirical rule provides specific percentages for data distribution within standard deviations in normal distributions.
Data sets with a mean and standard deviation can be visually represented to understand the spread of values.
The mean and standard deviation are used to mark the central and dispersion points on a data distribution graph.
Chebyshev’s theorem and the empirical rule offer insights into the distribution of data values in relation to the mean.
Understanding the spread of data is crucial for making informed decisions based on statistical analysis.
The video provides a clear explanation of statistical concepts related to data spread and distribution.
The presenter uses visual graphs to illustrate the concepts of variance, standard deviation, and data distribution.
The video concludes with a summary of the key points covered, reinforcing the learning objectives.
Transcripts
Browse More Related Video


5.0 / 5 (0 votes)
Thanks for rating: