Bayes' Theorem of Probability With Tree Diagrams & Venn Diagrams
TLDRThis video explains Bayes' theorem for calculating conditional probabilities. It starts with the formula for Bayes' theorem, then walks through a simple example of drawing numbered papers from a bottle. Next, it applies Bayes' theorem to a medical testing example, finding the probability a man has prostate cancer given he tested positive. A tree diagram and direct calculation are used to confirm the result. The video closes by noting that positive tests do not guarantee having a condition, but Bayes' theorem allows quantifying the actual probability.
Takeaways
- 😀 Bayes' theorem helps calculate conditional probability P(A|B) using P(B|A), P(A) and P(B)
- 📊 Uses Venn diagrams and tree diagrams to visualize and calculate conditional probabilities
- 📈 Example calculating P(A|B) directly and using Bayes' theorem gives same result
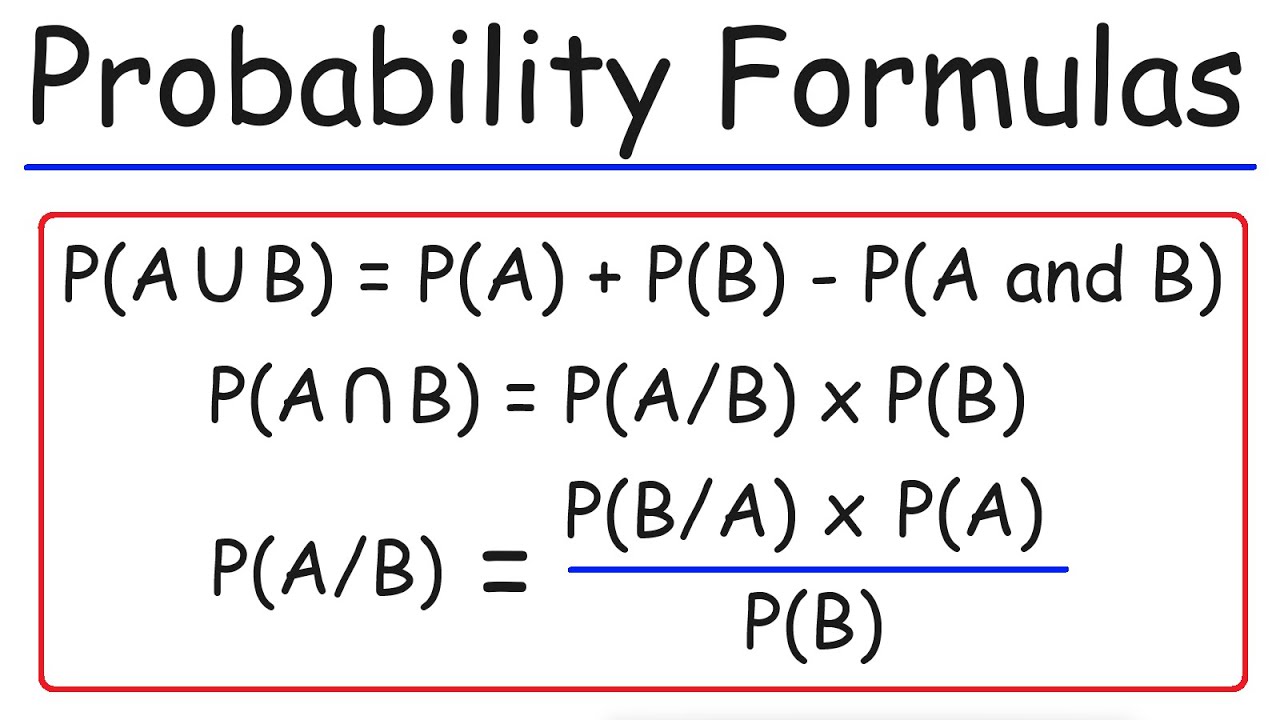
- 🚀 Key parts of Bayes' theorem: P(A|B) = P(B|A) * P(A) / P(B)
- 🧮 Walks through prostate cancer screening example applying Bayes' theorem
- 📊 Uses tree diagram to find P(positive test result) to use in Bayes' theorem
- ✅ Confirm Bayes' theorem result by analyzing cancer rates in sample population
- ⚠️ Positive test ≠ having the condition - important to understand false positives
- 💡 Two methods shown: Bayes' theorem formula and analyzing sample population data
- 🎓 Great real-world example illustrating practical use and interpretation of Bayes' theorem
Q & A
What is Bayes' theorem used for?
-Bayes' theorem is used to calculate conditional probabilities - the probability of an event occurring given that another event has already occurred. It allows us to update our beliefs about the likelihood of an event as we get new information.
What formula shows Bayes' theorem?
-Bayes' theorem is represented by the formula: P(A|B) = P(B|A) x P(A) / P(B). Here, P(A|B) is the conditional probability of A given B has occurred, P(B|A) is the conditional probability of B given A has occurred, P(A) is the standalone probability of A occurring, and P(B) is the standalone probability of B occurring.
What information do you need to use Bayes' theorem?
-To use Bayes' theorem, you need to know: 1) P(B|A) - the conditional probability of event B occurring given event A has occurred, 2) P(A) - the standalone probability of event A occurring, and 3) P(B) - the standalone probability of event B occurring.
How can a tree diagram help calculate probabilities for Bayes' theorem?
-A tree diagram visually breaks down the different conditional probabilities and makes it easier to calculate the total probability of various outcomes. It shows the probabilities of each step in a sequential manner which can then be multiplied to get joint probabilities.
What was the medical testing example in the video illustrating?
-The medical testing example illustrated that even if a test result is positive for a condition, there is still a probability that the person does not actually have the condition. It showed how Bayes' theorem can be used to quantify the chance of having the condition vs not having it given the test result.
What proportion of men will get prostate cancer based on the study?
-According to the study cited, 12% of men will likely develop prostate cancer at some point in their lives.
What is the probability a man has cancer given a positive test result?
-Using Bayes' theorem, the probability a man has prostate cancer given that he tests positive is 68.3%.
How can you calculate relevant probabilities without Bayes' theorem?
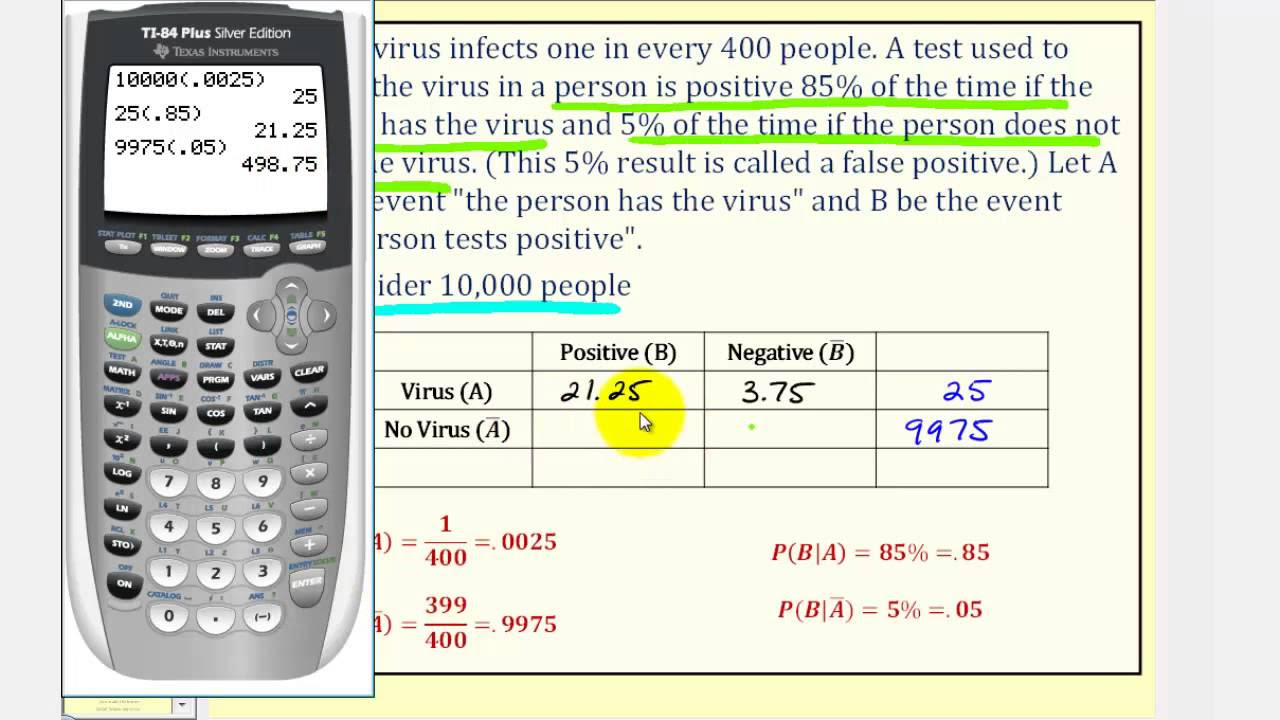
-You can use a tree diagram and calculate probabilities based on total populations and percentages. For example, if 10,000 people total and 12% have cancer, then 1,200 people have cancer. This allows you to calculate joint and conditional probabilities.
Why have two methods to calculate the probabilities?
-Having two methods serves as a way to double check your work. Getting the same final probability using both Bayes' theorem and the tree diagram method confirms the calculations are correct.
What is the takeaway from the medical testing example?
-The key takeaway is that a positive test result does not guarantee that someone has a condition. There is still a possibility the test result is a false positive. Quantifying these probabilities allows better decision making regarding diagnosis and treatment.
Outlines
😊 Overview of Conditional Probability Formulas and Bayes' Theorem Equation
Introduces basic conditional probability formulas and shows how Bayes' theorem allows calculation of a conditional probability when the reverse conditional probability is known along with other probability values. Provides a simple example with drawing numbered papers from a bottle to illustrate the use of Bayes' theorem.
😀 Using Bayes' Theorem via a Venn Diagram and Confirming with Conditional Probability Formula
Works through a detailed example applying Bayes' theorem to find a conditional probability using a Venn diagram. Then confirms the calculation directly using the conditional probability formula.
📈 Tree Diagram and Bayes' Theorem Applied to Medical Testing Scenario
Goes through a medical testing example with prostate cancer screening exams. Lays out the given probability values and uses a tree diagram and Bayes' theorem to determine the probability that a man has cancer given he tested positive.
😎 Confirming Medical Testing Example Results Using Total Population Analysis
Validates the previous medical testing example by looking at a total population of 10,000 and determining the numbers with and without cancer as well as positive and negative test results. Shows the probability calculation yields the same final result.
Mindmap
Keywords
💡Bayes' theorem
💡conditional probability
💡venn diagram
💡sample space
💡tree diagram
💡false positive
💡positive predictive value
💡negative test result
💡prevalence
💡sensitivity
Highlights
Goes over formulas for conditional probability and sets up Bayes' theorem
Gives the formula for Bayes' theorem to calculate conditional probabilities
Illustrates Bayes' theorem with an example of drawing numbers from a bottle
Walks through calculating conditional probability using Bayes' theorem
Confirms Bayes' theorem calculation using standard conditional probability
Introduces medical testing example to illustrate another use of Bayes' theorem
Writes out information provided in the medical testing example
Sets up Bayes' theorem to solve for probability of cancer given positive test
Constructs a tree diagram to calculate needed probabilities
Plug in values to Bayes' theorem formula to solve problem
Shows second way to solve using raw numbers rather than probabilities
Demonstrates both methods yield the same result
Discusses implications of positive test results
Highlights risk of false positives with testing
Emphasizes properly solving for requested probability
Transcripts
Browse More Related Video
Probability: Bayes' Theorem

Probability Part 2: Updating Your Beliefs with Bayes: Crash Course Statistics #14
Probability Formulas, Symbols & Notations - Marginal, Joint, & Conditional Probabilities

Bayes theorem, the geometry of changing beliefs
You Know I'm All About that Bayes: Crash Course Statistics #24

Bayes in Science and Everyday Life: Crash Course Statistics #25
5.0 / 5 (0 votes)
Thanks for rating: