Continuous vs Discrete Data
TLDRThe video explains the difference between continuous and discrete data. Continuous data can take on any value within an interval and can be measured, like temperature or body weight. Discrete data can only have specific values and is counted, like the number of cats or books. Examples are provided to distinguish continuous vs discrete data. The video also covers how to identify if a graph displays continuous or discrete data based on whether there are gaps/individual points (discrete) or a smooth line (continuous).
Takeaways
- 😀 Continuous data can take any value within an interval, discrete data only has specific values
- 📏 Continuous data can be measured, discrete data is counted
- 📈 Examples of continuous data: temperature, body weight, exact age
- ➗ Examples of discrete data: number of cats, doctors, books
- 🚗 Speed of a car is continuous data
- 🐈 Number of cats is discrete data
- 👥 Number of students is discrete data
- 🎂 Age rounded to a whole number is discrete data
- 🔢 Exact unrounded age is continuous data
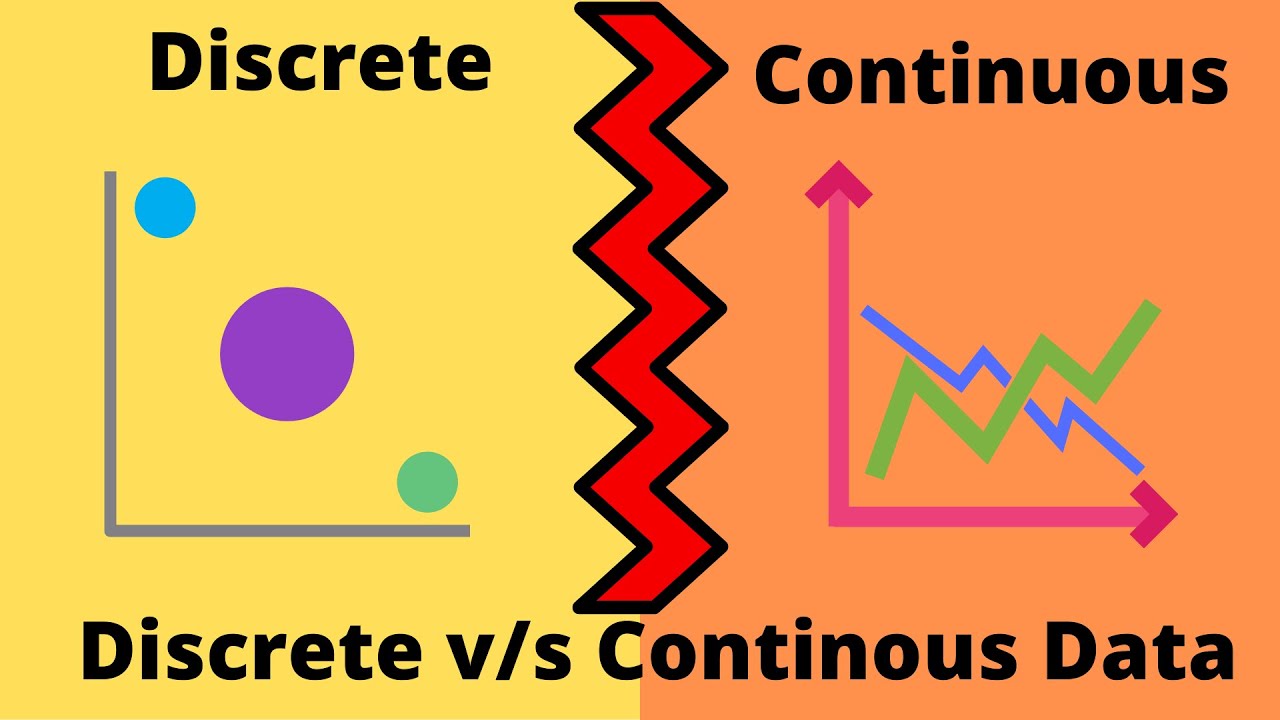
- 📊 A continuous data graph has a smooth line, discrete data graphs have individual unconnected points
Q & A
What is the difference between continuous and discrete data?
-Continuous data can take on any value within an interval, whereas discrete data can only take on specific, distinct values.
What is an example of continuous data provided in the transcript?
-Examples of continuous data provided are temperature, body weight, height of a student, and exact age.
What is an example of discrete data provided in the transcript?
-Examples of discrete data provided are the number of cats in a neighborhood, number of doctors in a town, number of books on a shelf, and number of students in a classroom.
How can you distinguish between continuous and discrete graphs?
-Continuous graphs have a smooth, connected line with no breaks or jumps. Discrete graphs have individual, disconnected points.
What does it mean to round age to the nearest whole number?
-Rounding age to the nearest whole number means only using integer values for age with no decimal places, making it a discrete set of data.
Why can't there be half a cat?
-You can count whole cats, but not fractions of a cat. So the number of cats represents discrete data.
Could speed of a car be a discrete set of data?
-No, speed of a car is typically measured and can take on decimal values, so it represents continuous data.
What are some key characteristics of continuous data?
-Continuous data can be measured, takes on decimal values, and represents quantities.
What are some key characteristics of discrete data?
-Discrete data deals with whole numbers, can be counted, and represents distinct individual values.
How do you determine if a set of data is continuous or discrete?
-Look at if the values can only be counted as whole numbers (discrete) or if they can be measured and take on decimal values (continuous).
Outlines
😀 Defining Continuous vs Discrete Data
Paragraph 1 defines continuous and discrete data, providing examples. Continuous data can take on any value in an interval and be measured, like temperature. Discrete data can only have specific values and be counted, like the outcome of a dice roll.
😀 Examples of Continuous vs Discrete Data
Paragraph 2 provides several examples to distinguish continuous vs discrete data. Speed, weight, height are continuous as they can be measured. Number of cats, doctors, books are discrete as they can be counted.
Mindmap
Keywords
💡continuous data
💡discrete data
💡measured
💡counted
💡temperature
💡six-sided die
💡graph
💡discontinuities
💡quantized
💡intervals
Highlights
Continuous data can take on any value in an interval, discrete data can only have specific values
Continuous data is measured, discrete data is counted
Temperature is an example of continuous data, the number of sides on a die is discrete data
Car speed is continuous data, number of cats is discrete data
Body weight is continuous, number of doctors is discrete
Number of books is discrete, height is continuous
Number of students is discrete data
Age rounded is discrete data, exact age is continuous data
Continuous graphs have connected lines, discrete graphs have individual, disconnected points
Smooth, connected lines represent continuous data
Discrete graphs have points that are not connected
Gaps or jumps mean a graph shows discrete data
Continuous data allows fractional values between points
Discrete data only permits specific integer values
The type of data determines the appropriate type of graph
Transcripts
Browse More Related Video
Discrete v/s Continuous Data - What ? How ? || Discrete Data || Continuous Data || Basic Statistics
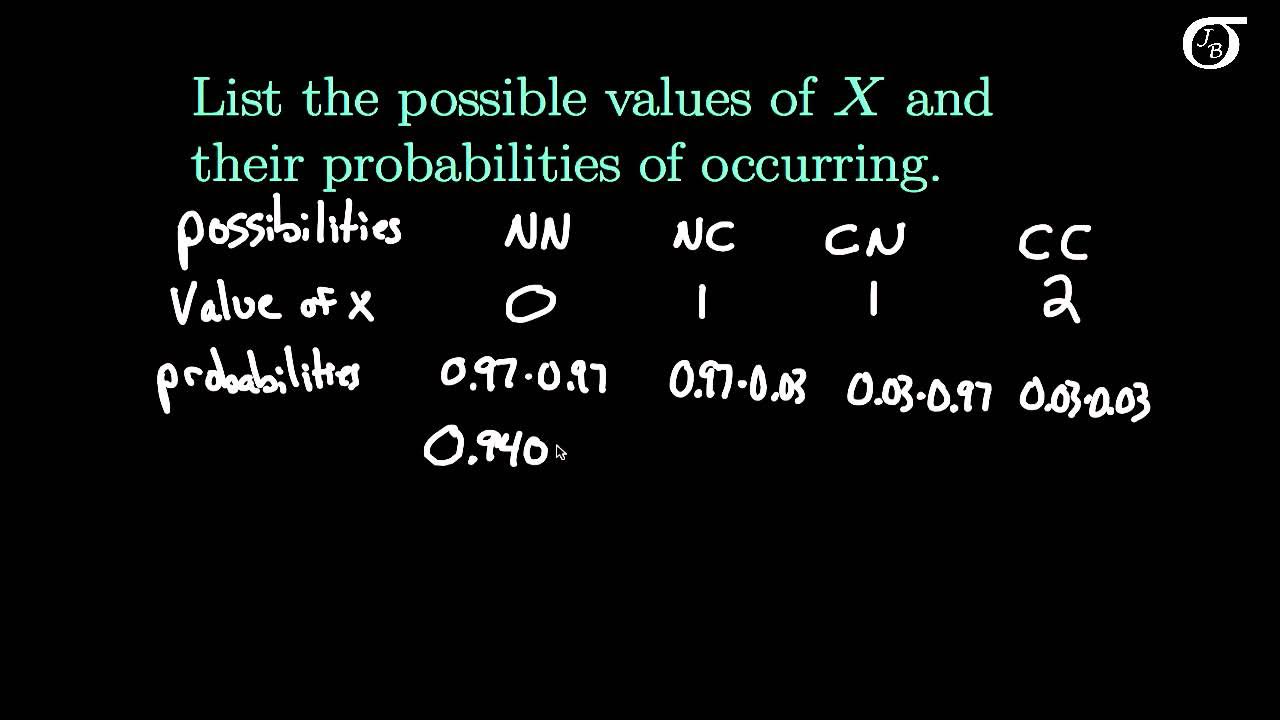
Introduction to Discrete Random Variables and Discrete Probability Distributions

Discrete and continuous random variables | Probability and Statistics | Khan Academy

Discrete vs. Continuous Relationships Tutorial
Types of Data: Categorical vs Numerical Data
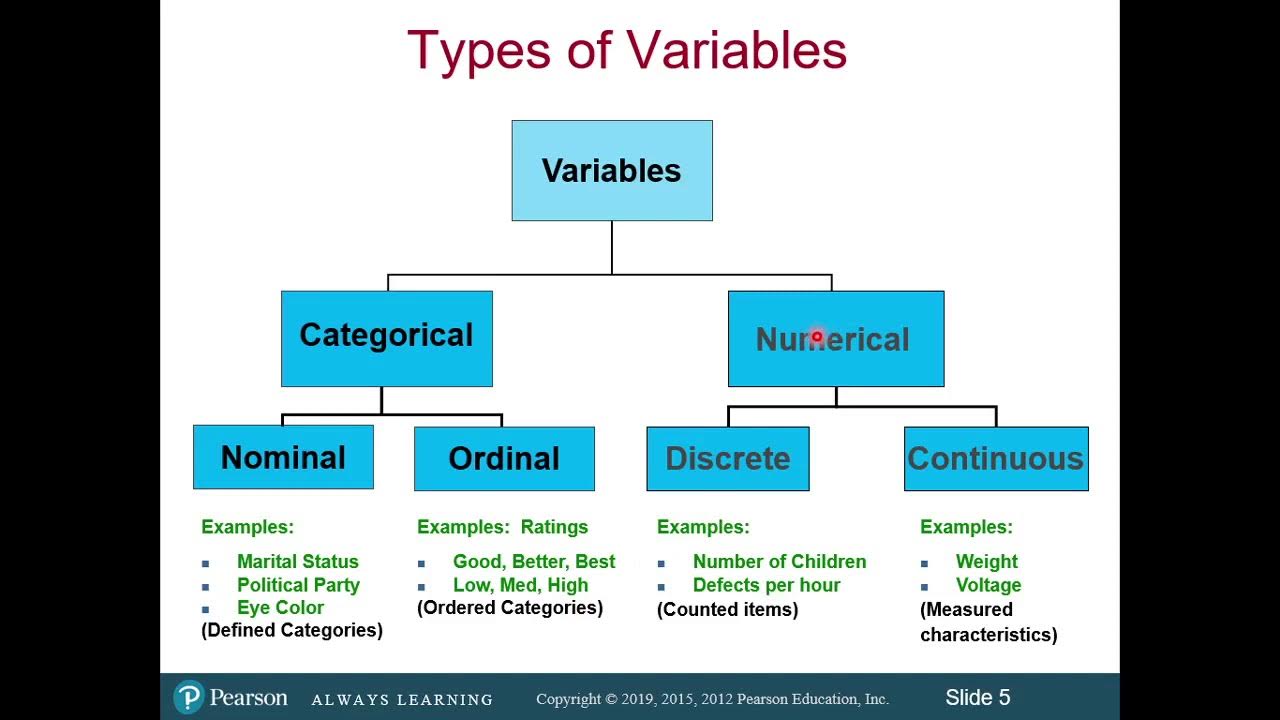
Classification of Variables and Types of Measurement Scales
5.0 / 5 (0 votes)
Thanks for rating: