Student's T Distribution - Confidence Intervals & Margin of Error
TLDRThe video explains how to construct confidence intervals using the student's t-distribution, when the sample size is small and population standard deviation is unknown. It steps through two examples, explaining when to use the t-distribution vs the normal distribution. Concepts covered include calculating the t-score from the table based on degrees of freedom and alpha value, determining the error bound for the mean using the t-score and sample standard deviation, and constructing the confidence interval by taking the sample mean plus/minus the error bound.
Takeaways
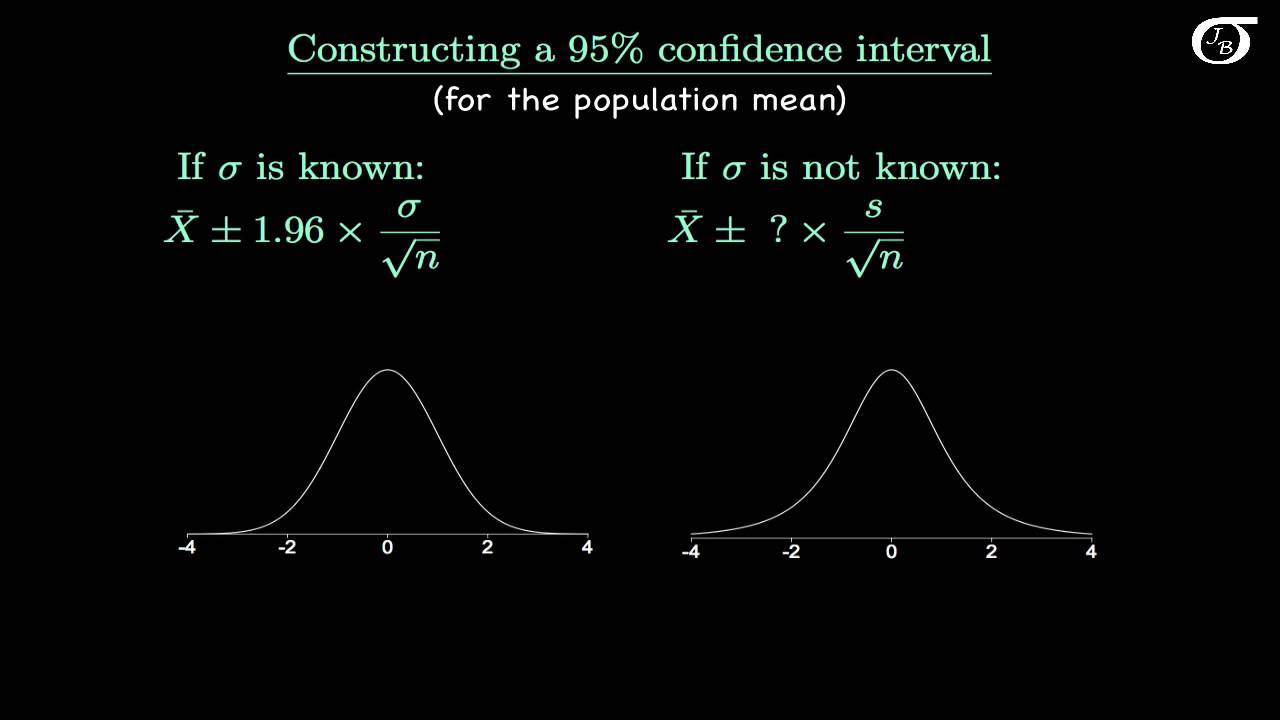
- 😀 To construct a confidence interval, first determine if you should use the normal distribution or Student's t-distribution
- 😊 Use Student's t-distribution if you have the sample standard deviation and n < 30
- 📏 The error bound for the mean (EBM) depends on the t-value, sample standard deviation, and sample size n
- 📊 To find the appropriate t-value, use the Student's t-distribution table based on the degrees of freedom and α/2
- 🧮 The sample mean ± EBM gives the confidence interval range
- 🚀 The wider the confidence interval, the less precise the estimate of the true population mean
- 🎯 Narrow confidence intervals are more desirable because they indicate greater precision
- 🔢 Calculating standard deviation involves subtracting each data point from the mean, squaring, and summing the results
- 🤓 Knowing when to use Student's t vs the normal distribution and how to calculate EBMs is critical for statistical analysis
- 🎉 Constructing accurate confidence intervals allows you to estimate unknown population parameters from sample data
Q & A
What is the first step in constructing a confidence interval using the student's t-distribution?
-The first step is to determine the degrees of freedom, which is calculated as n - 1 where n is the sample size. In this example, the sample size is 20 students, so the degrees of freedom is 20 - 1 = 19.
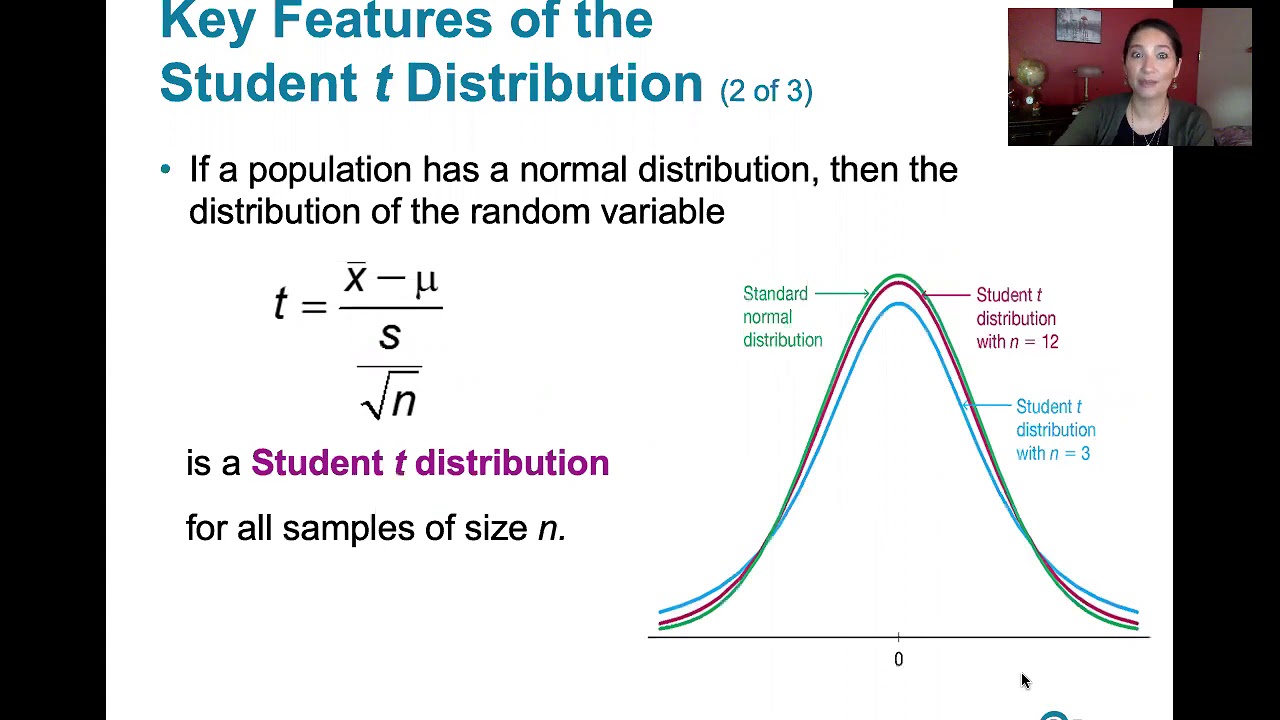
How do you know when to use the student's t-distribution versus the normal distribution?
-Use the student's t-distribution when you have the sample standard deviation and the sample size n is less than 30. Use the normal distribution when you know the population standard deviation.
What does the Greek letter nu (ν) represent in the confidence interval formula?
-The Greek letter nu (ν) represents the degrees of freedom, which is calculated as n - 1 where n is the sample size.
What is alpha over 2 and how is it calculated?
-Alpha over 2 is the value for one-tailed alpha. It is calculated by taking 1 minus the confidence level, divided by 2. In this example, alpha over 2 is 1 - 0.95 / 2 = 0.025 for a 95% confidence level.
What is the margin of error (EBM) formula for this type of problem?
-The EBM formula is the t-value times the sample standard deviation divided by the square root of the sample size n.
What does the confidence interval tell us?
-The confidence interval tells us a range within which we can be 95% confident that the true population mean lies.
In the second problem, why is the student's t-distribution used rather than the normal distribution?
-The student's t-distribution is used because the sample standard deviation is given rather than the population standard deviation, and the sample size n = 10 which is less than 30.
How many degrees of freedom are there in the second example?
-There are n - 1 = 10 - 1 = 9 degrees of freedom.
What is the value of alpha over 2 in the second example when constructing a 90% confidence interval?
-For a 90% confidence interval, alpha is 0.10. Alpha over 2 is 0.10 / 2 = 0.05.
What is the range of scores we can be 90% confident contains the true mean score of all students in the chemistry class?
-We can be 90% confident the true mean score lies between 73.213 and 86.787.
Outlines
📝 Solving problems using the student's t-distribution table
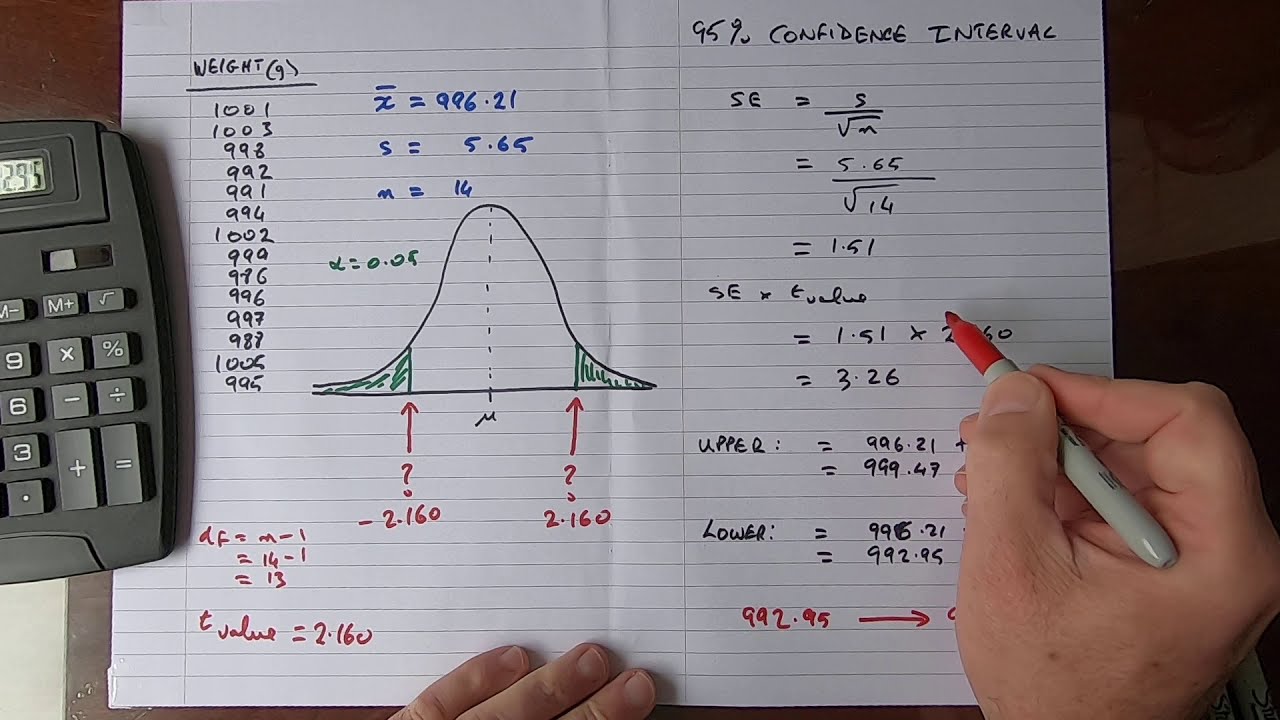
This paragraph introduces the problem of constructing a 95% confidence interval for the average weight of students at a school, based on a sample of 20 students. It explains the need to use the student's t-distribution instead of the normal distribution, due to having the sample standard deviation and a small sample size (n<30).
📈 Determining the t-value from the table
This paragraph shows how to determine the t-value of 2.093 from the student's t-distribution table, using the degrees of freedom (19) and α/2 value (0.025). It then uses this t-value to calculate the confidence interval boundaries.
🧪 Calculating sample statistics for student scores
This paragraph works through part A of a chemistry exam score problem - calculating the sample mean (80) and sample standard deviation (11.709) from a set of 10 scores. It shows work for summing and squaring the deviations.
🚀 Constructing a 90% confidence interval
This paragraph covers parts B and C of the exam score problem, using the sample statistics to determine the margin of error (EBM) and construct a 90% confidence interval from 73.213 to 86.787 for the population mean exam score.
Mindmap
Keywords
💡confidence interval
💡standard deviation
💡margin of error
💡t-distribution
💡t-score
💡sample mean
💡degrees of freedom
💡one-tailed alpha
💡null hypothesis
💡population mean
Highlights
Use Student's t-distribution when sample size is less than 30 and you have the sample standard deviation
Calculate the t-score using the Student's t-distribution table based on degrees of freedom and significance level
Construct confidence interval using sample mean, t-score, sample standard deviation and sample size
Margin of error formula is the t-score times the sample standard deviation over the square root of the sample size
Calculate sample mean by summing all the values and dividing by the sample size
Calculate sample standard deviation using the deviation scores, squaring them and dividing by n-1
Determine the t-score for a given confidence level, degrees of freedom and using the t-table
Margin of error depends on the t-score, sample standard deviation and sample size
Construct confidence interval by taking the sample mean plus/minus the margin of error
Confidence interval gives a range of likely values for the population mean
Using Student's t-distribution accounts for additional uncertainty from having a sample rather than the entire population
Larger sample sizes allow the use of normal distribution instead of Student's t
Visual representation shows how significance level is split between upper and lower tails
Can show work for standard deviation more concisely using squared deviation scores
Confidence level impacts the margin of error and width of the confidence interval
Transcripts
Browse More Related Video
Introduction to the t Distribution (non-technical)

Elementary Statistics - Chapter 7 - Estimating Parameters and Determining Sample Sizes Part 2
7.2.1 Estimating a Population Mean - Student t Distribution and Finding Critical t Values
Confidence Intervals | Population Mean: σ Unknown
7.2.0 Estimating a Population Mean - Lesson Overview, Key Concepts, Learning Outcomes
How To...Calculate the Confidence Interval for a Sample
5.0 / 5 (0 votes)
Thanks for rating: