WHAT IS A "SAMPLING DISTRIBUTION" and how is it different from a "sample distribution"... and stuff
TLDRThe video script delves into the concept of sampling distributions, emphasizing their importance in statistics. It explains how sampling distributions for proportions and means are created through repeated sampling, resulting in a distribution of sample statistics like p-hat or x-bar. The script clarifies that these distributions tend to be normal, centered around the true population parameter, with standard deviations derived from the population's p and q for proportions, or the population standard deviation divided by the square root of the sample size for means. The goal is to illustrate the natural variability inherent in sampling and how it leads to the formation of these distributions.
Takeaways
- 🔍 Understanding the concept of sampling distributions is crucial for grasping statistical analysis.
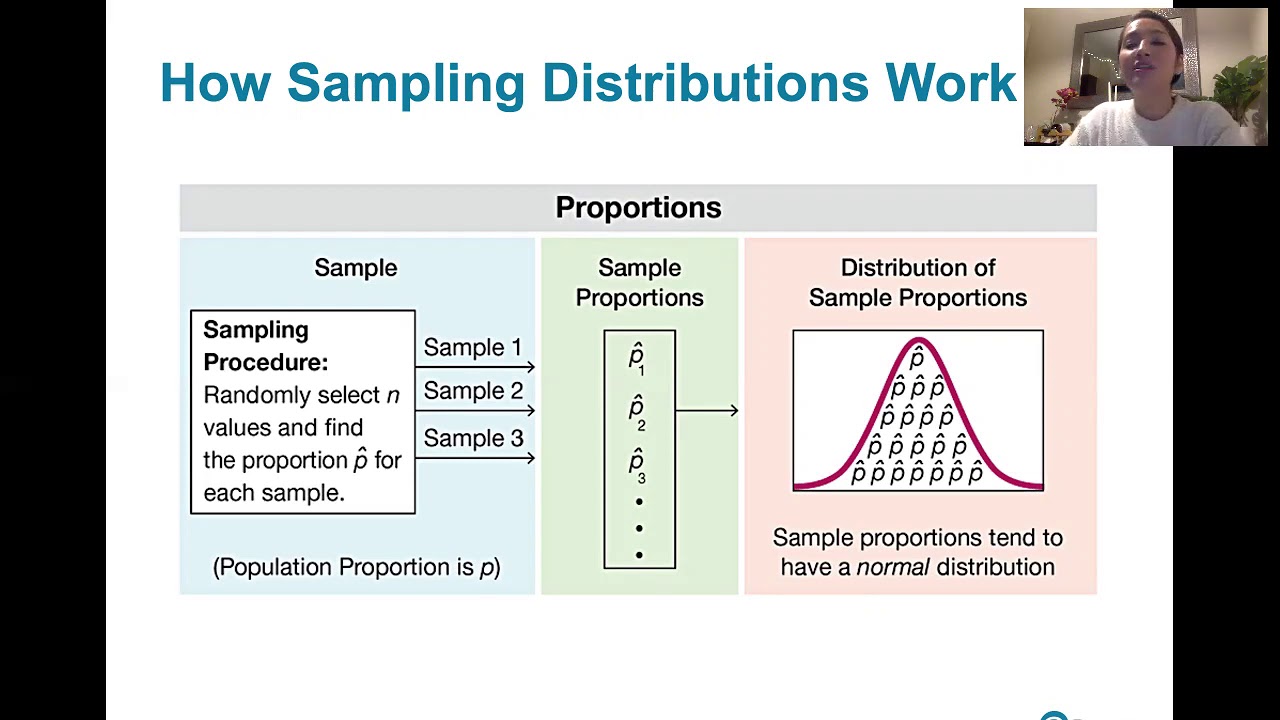
- 🔄 A sampling distribution is created by repeatedly taking samples and calculating statistics from those samples.
- 📊 There are two primary types of sampling distributions introduced: for proportions and for means.
- 🎯 The population proportion (p) is a known parameter, and the sample proportion (p-hat) is an estimate derived from samples.
- 📐 Sampling variability, also known as sampling error, is the natural fluctuation in sample statistics due to different samples.
- 📈 The sampling distribution for proportions tends to be normally distributed and centered around the true population proportion (p).
- 📉 The standard deviation of the sampling distribution for proportions is given by the formula \( \sqrt{\frac{p(1-p)}{N}} \), where N is the sample size.
- 📚 The mean of the sampling distribution for proportions is equal to the true population proportion (p).
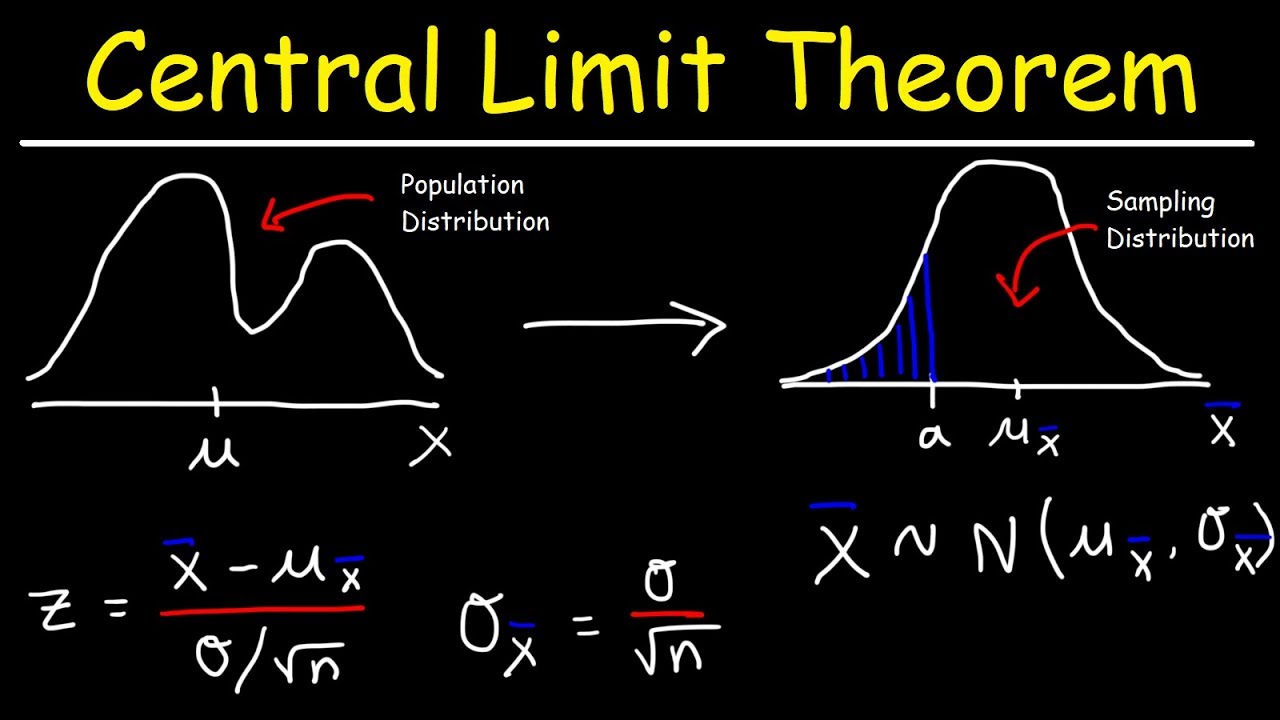
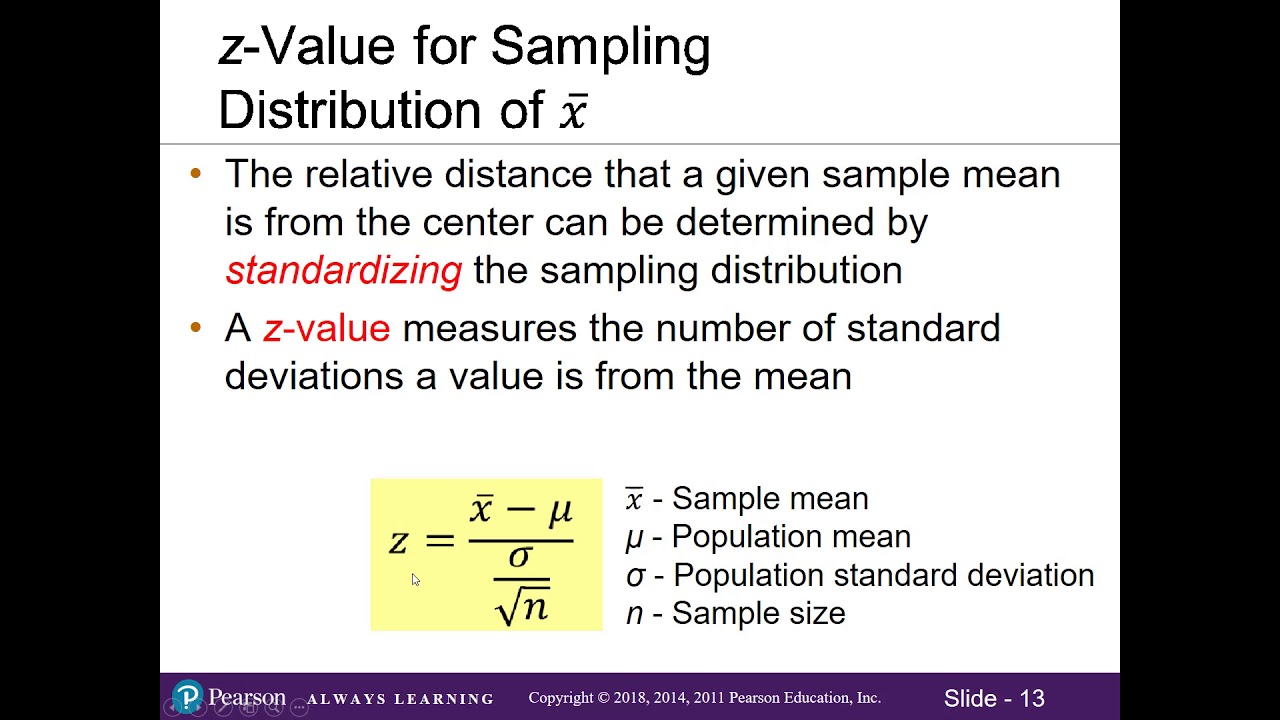
- 📝 For the sampling distribution of means, the mean of all sample means (x-bars) is equal to the true population mean (mu).
- ⏱ The standard deviation of the sampling distribution for means is calculated as the population standard deviation divided by the square root of the sample size.
- 📉 The sampling distribution for means also tends to be normally distributed, especially with large sample sizes or when the population is normally distributed.
Q & A
What is a sampling distribution?
-A sampling distribution is the distribution of a statistic (like the sample mean or sample proportion) obtained by taking many random samples from a population.
How is a sampling distribution created?
-A sampling distribution is created by repeatedly taking random samples from a population, calculating a statistic for each sample, and plotting these statistics to form a distribution.
What is the difference between a population proportion (p) and a sample proportion (p-hat)?
-The population proportion (p) is the true proportion of a characteristic in the entire population, while the sample proportion (p-hat) is the proportion of that characteristic in a sample taken from the population.
Why do sample proportions (p-hats) vary from the population proportion (p)?
-Sample proportions vary from the population proportion due to sampling variability or sampling error, which is the natural variation that occurs because different random samples will have different compositions.
What is sampling variability?
-Sampling variability is the natural variation in statistics (like p-hat) that occurs when different random samples are taken from the same population.
What does it mean if a sampling distribution is approximately normal?
-If a sampling distribution is approximately normal, it means that the distribution of the sample statistics (like p-hats or x-bars) is bell-shaped and symmetric, centered around the true population parameter.
What does the mean of the sampling distribution of sample proportions (p-hats) represent?
-The mean of the sampling distribution of sample proportions (p-hats) is equal to the true population proportion (p).
How is the standard deviation of the sampling distribution of sample proportions calculated?
-The standard deviation of the sampling distribution of sample proportions is calculated using the formula sqrt(pq/n), where p is the population proportion, q is 1-p, and n is the sample size.
What is the difference between the distribution of a sample and a sampling distribution?
-The distribution of a sample is a histogram of the values in a single sample, while a sampling distribution is a histogram of a statistic (like p-hat or x-bar) obtained from many samples.
Why is it important to understand sampling distributions?
-Understanding sampling distributions is important because it helps us make inferences about the population from sample data and understand the variability and reliability of our sample statistics.
Outlines
📊 Understanding Sampling Distributions for Proportions and Means
This paragraph introduces the concept of sampling distributions, emphasizing their importance in statistics. It explains how sampling distributions are created through repeated sampling from a population. The focus is on two main types: sampling distribution for proportions and means. The speaker uses the example of a population where 20% of people are 'sexy and they know it' to illustrate the variability in sample proportions (p-hat). The paragraph also touches on the idea of sampling variability or error, which is the natural fluctuation in sample statistics. It concludes by describing how these sample proportions, when taken many times, form a sampling distribution that is approximately normal and centered around the true population proportion (P).
📚 Mathematical Properties of Sampling Distributions
The second paragraph delves into the mathematical aspects of sampling distributions, specifically for proportions and means. It clarifies that the mean of all sample proportions (p-hats) is equal to the true population proportion (P). The standard deviation of these sample proportions is given by the square root of the product of P and Q (1-P) divided by the sample size (N). The speaker also discusses the sampling distribution for means, using the example of the average number of texts sent by students during a class. It is stated that the mean of all sample means (x-bars) is equal to the true population mean (mu), and the standard deviation of these sample means is the population standard deviation divided by the square root of the sample size. The paragraph highlights the normal distribution pattern of these sampling distributions and the probabilities associated with the percentages falling within one or two standard deviations from the mean.
🔍 The Essence of Sampling Distributions and Their Creation
The final paragraph reinforces the concept of sampling distributions, clarifying that they are not the distribution of a single sample or the population itself, but rather the distribution of a statistic calculated from many samples. It explains that any attribute calculated from a sample can form a sampling distribution, such as sample standard deviations or medians. The paragraph emphasizes that sampling distributions are created by repeatedly taking samples, calculating the relevant statistic, and compiling these statistics. The speaker illustrates this with the idea of creating a new sampling distribution of sample medians. The paragraph concludes by reiterating that sampling distributions consist of statistics that generally cluster around the true parameter value in the population.
Mindmap
Keywords
💡Sampling Distributions
💡Proportions
💡Sample Proportion (p-hat)
💡Sampling Variability
💡Population Parameter
💡Sample Mean (x-bar)
💡Standard Deviation
💡Normal Distribution
💡Central Limit Theorem
💡Statistic
💡Estimation
Highlights
The concept of sampling distributions is introduced as a fundamental aspect of statistical analysis.
Two primary types of sampling distributions are discussed: for proportions and for means.
The idea that sampling distributions are created through repeated sampling is emphasized.
A hypothetical scenario is used to illustrate the sampling distribution of proportions, with 'sexy' people as an example.
The population proportion (p) is contrasted with the sample proportion (p-hat).
The variability of sample proportions is referred to as sampling variability or error.
The central limit theorem is alluded to, showing that sample proportions tend to form a normal distribution centered around the true population proportion.
The mean of all sample proportions (p-hats) is stated to be equal to the true population proportion (p).
The standard deviation of the sampling distribution of proportions is given by the formula \( \sqrt{\frac{p(1-p)}{N}} \).
An example of the sampling distribution of means is given using the average number of texts sent by students during class.
The sample mean (x-bar) is introduced as a statistic derived from samples.
The impact of outliers in samples on the sample mean is discussed.
The mean of all sample means (x-bars) is stated to be equal to the true population mean (mu).
The standard deviation of the sampling distribution of means is given by the formula \( \frac{\sigma}{\sqrt{N}} \), where sigma is the population standard deviation.
The importance of sample size in the shape of the sampling distribution is highlighted.
The concept of sampling distributions can be extended to any statistic calculated from a sample, such as medians or variances.
The distinction between a sampling distribution and the distribution of a sample or the population is clarified.
The practical application of sampling distributions in understanding the natural variability in sample statistics is emphasized.
The transcript concludes with a summary of the key points about sampling distributions and their significance in statistical inference.
Transcripts
Browse More Related Video
Top 10 Tips for AP Statistics Unit 5 Sampling Distributions
6.3.1 Sampling Distributions and Estimators - Sampling Distributions Described and Defined
The Sampling Distribution of the Sample Mean
6.3.0 Sampling Distributions and Estimators - Lesson Overview, Learning Outcomes and Key Concepts
Central Limit Theorem - Sampling Distribution of Sample Means - Stats & Probability
7.2 Sampling Distribution of the Mean (Updated)
5.0 / 5 (0 votes)
Thanks for rating: