6.3.0 Sampling Distributions and Estimators - Lesson Overview, Learning Outcomes and Key Concepts
TLDRThis video script offers an in-depth look at Lesson 6.3, focusing on sampling, distributions, and estimators. It builds upon the concepts of normal probability distributions introduced in previous lessons, shifting the focus from the original population data to the distribution of sample statistics like sample means and proportions. The goal is to understand how these sampling distributions can inform us about the population parameters. The lesson also aims to clarify the characteristics of sampling distributions and the difference between biased and unbiased estimators, with examples provided to deepen understanding.
Takeaways
- 📚 The video provides an overview of Lesson 6.3, focusing on sampling, distributions, and estimators based on slides from Pearson and modified for the course.
- 📈 Lesson 6.3 is part of Chapter 6, which discusses normal probability distributions, following the introduction of continuous probability distributions and standard normal distribution in 6.1.
- 🔄 In 6.2, the correspondence between non-standard normal distributions and standard normal distributions was covered, allowing for conversion and application of methods from 6.1.
- 🔍 The focus of 6.3 shifts from the original population data to the distribution of sample statistics, which is a 'meta' level of understanding.
- 📊 Key concepts include understanding the sampling distribution of a statistic and summarizing it with a probability distribution to infer about the population parameter.
- 📝 Statistics are associated with samples, while parameters are associated with the population, and the distribution of sample means (x-bars) can provide insights into the population mean.
- 🎯 The learning outcomes for 6.3 include describing the characteristics of a sampling distribution, understanding its relation to the population proportion, and discussing sample proportions, means, and variances.
- 🔍 The video will cover the specific sampling distribution associated with sample proportions and its relation to the population proportion.
- 📉 The lesson will also address the sampling distribution of sample means and variances, and how they inform us about the population parameters.
- 📌 The difference between biased and unbiased estimators will be discussed, with examples provided for each.
- 🤔 The video aims to deepen the understanding of statistical concepts by examining them at a higher level of abstraction, focusing on the implications of sample statistics for population parameters.
Q & A
What is the main focus of Lesson 6.3 in the video?
-The main focus of Lesson 6.3 is on sampling, distributions, and estimators, specifically the distribution of different sample statistics and how they relate to the corresponding population parameters.
What are the four sections covered in Chapter Six of 'Essentials of Statistics' by Mario Triola?
-The four sections covered in Chapter Six are: 6.1 on continuous probability distributions and the standard normal distribution, 6.2 on non-standard normal distributions, 6.3 on sampling distributions and estimators, and 6.4 on the central limit theorem.
What is the correlation found in 6.1 between areas under a curve and z-scores?
-In 6.1, a correlation was established between the areas under the normal distribution curve and the corresponding z-scores, which helps in understanding the probability of different ranges of data.
How can a non-standard normal distribution be converted to a standard normal distribution?
-A non-standard normal distribution can be converted to a standard normal distribution by using a correspondence that allows for the transformation of the distribution's mean and standard deviation to zero and one, respectively.
What is the difference between statistics and parameters in the context of the script?
-Statistics are values calculated from samples, such as the sample mean (x̄), while parameters are values that describe the entire population, such as the population mean.
What is a sampling distribution and why is it important?
-A sampling distribution is the probability distribution of a given statistic based on a random sample. It is important because it provides information about the population parameter from which the sample was drawn.
What is meant by summarizing a sampling distribution with a probability distribution?
-Summarizing a sampling distribution with a probability distribution involves describing the characteristics of the distribution, such as its mean and standard deviation, which can then be used to make inferences about the population.
What are the learning outcomes for Lesson 6.3 as mentioned in the script?
-The learning outcomes for Lesson 6.3 include describing the characteristics of a sampling distribution, understanding the specific sampling distribution associated with sample proportions and means, and discussing the difference between biased and unbiased estimators with examples.
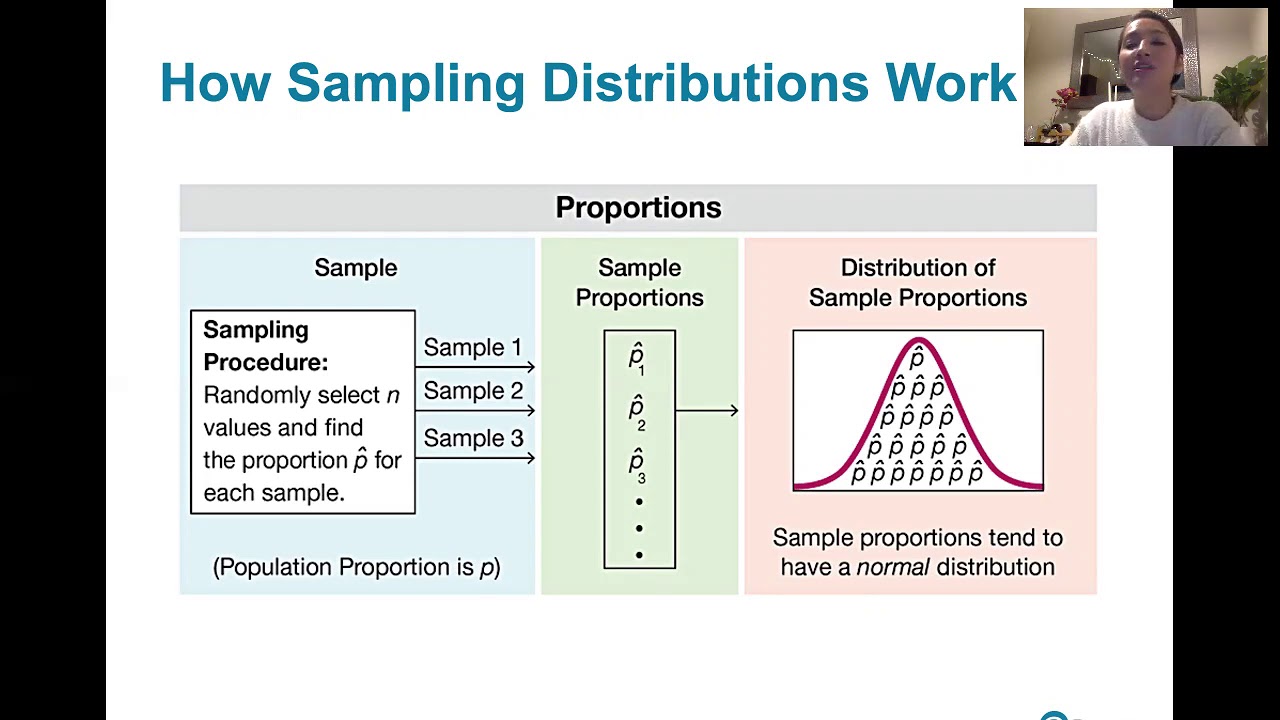
What is the relationship between the sampling distribution of sample proportions and the population proportion?
-The sampling distribution of sample proportions provides an estimate of the population proportion. As the sample size increases, the sampling distribution of the sample proportion tends to approximate a normal distribution, according to the central limit theorem.
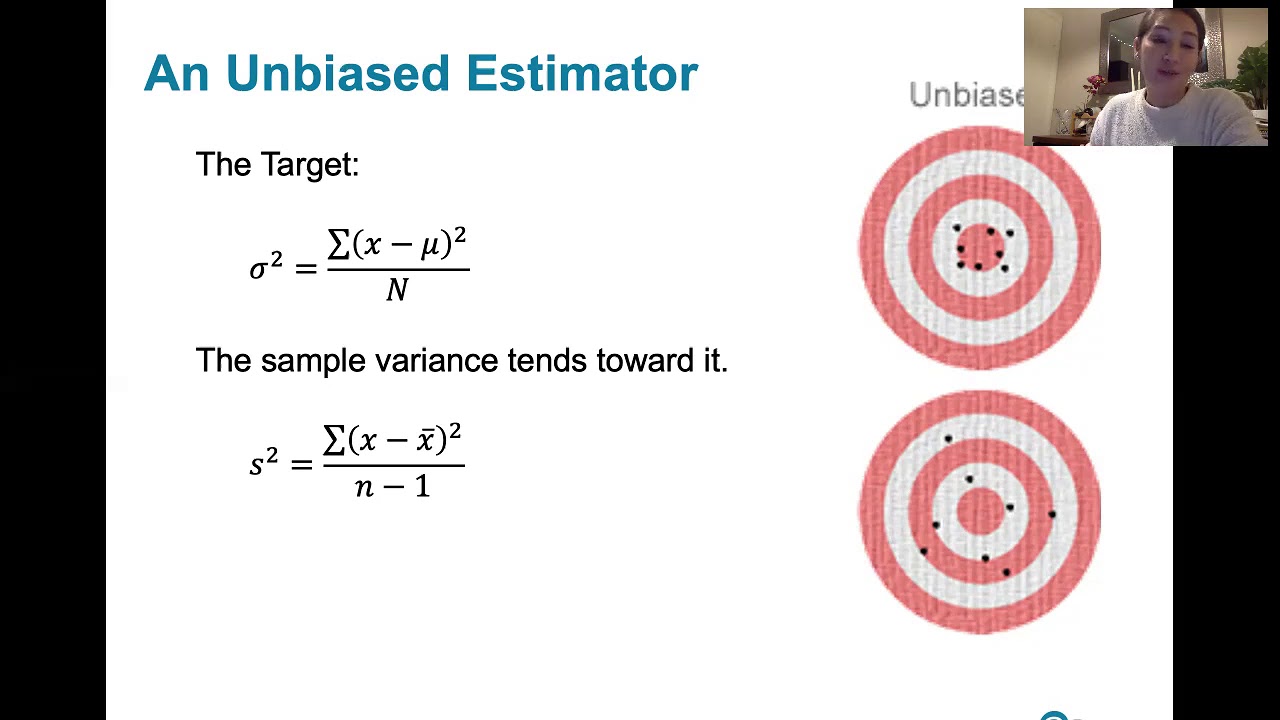
What are biased and unbiased estimators, and why is their distinction important?
-Biased estimators are those that consistently overestimate or underestimate the true population parameter, while unbiased estimators estimate the parameter without systematic error. The distinction is important for the accuracy and reliability of statistical inferences.
Can you provide an example of a biased estimator?
-An example of a biased estimator could be using the range of a sample to estimate the population standard deviation, as it tends to overestimate the variability in the population.
How does the script suggest that the understanding of statistical concepts will be enriched in Lesson 6.3?
-The script suggests that the understanding of statistical concepts will be enriched by looking at them from a slightly different level, focusing on the distribution of sample statistics rather than the data itself, which provides a more 'meta' perspective on the concepts.
Outlines
📚 Introduction to Lesson 6.3: Sampling Distributions and Estimators
This paragraph introduces the third section of Chapter 6 from 'Essentials of Statistics' by Mario Triola, focusing on sampling, distributions, and estimators. It builds upon the previous lessons on continuous probability distributions, normal probability distributions, and the standard normal distribution. The speaker explains the shift in focus from the data of the original population to the distribution of sample statistics. The main goal is to understand the concept of a sampling distribution of a statistic, how to summarize it with a probability distribution, and what insights it provides about the population parameter. The paragraph also outlines the learning outcomes, which include describing the characteristics of a sampling distribution, the specific distribution associated with sample proportions, and the difference between biased and unbiased estimators, with examples provided.
Mindmap
Keywords
💡Sampling
💡Distributions
💡Estimators
💡Continuous Probability Distribution
💡Normal Probability Distribution
💡Standard Normal Distribution
💡Z-scores
💡Sample Mean (x-bar)
💡Sample Proportion
💡Sample Variance
💡Biased and Unbiased Estimators
Highlights
Overview of Lesson 6.3 covering sampling, distributions, and estimators based on slides from Pearson and textbook by Mario Triola.
Introduction to continuous probability distribution and normal probability distributions in Chapter 6.1.
Correlation found between areas under a curve and corresponding z-scores in 6.1.
Conversion of non-standard normal distributions to standard normal distributions in 6.2.
Focus shift in 6.3 from data itself to distribution of sample statistics.
Exploration of sampling distributions and estimators in a 'meta lecture'.
Key concepts include understanding sampling distribution of a statistic and summarizing it with a probability distribution.
Sampling distribution can provide insights about the corresponding population parameter.
Statistics calculated from samples (e.g., sample mean) can reveal information about the population mean.
Learning outcomes include describing characteristics of sampling distributions and their relation to population parameters.
Specific focus on sampling distributions of sample proportions and their relation to the population proportion.
Same focus applied to sample means and sample variances.
Discussion on the difference between biased and unbiased estimators.
Listing three examples of each type of estimator - biased and unbiased.
Understanding of various estimators and their bias implications.
Upcoming video will discuss the first learning outcome in detail.
Transcripts
Browse More Related Video
Top 10 Tips for AP Statistics Unit 5 Sampling Distributions
6.3.5 Sampling Distributions and Estimators - Biased and Unbiased Estimators

WHAT IS A "SAMPLING DISTRIBUTION" and how is it different from a "sample distribution"... and stuff
6.3.1 Sampling Distributions and Estimators - Sampling Distributions Described and Defined
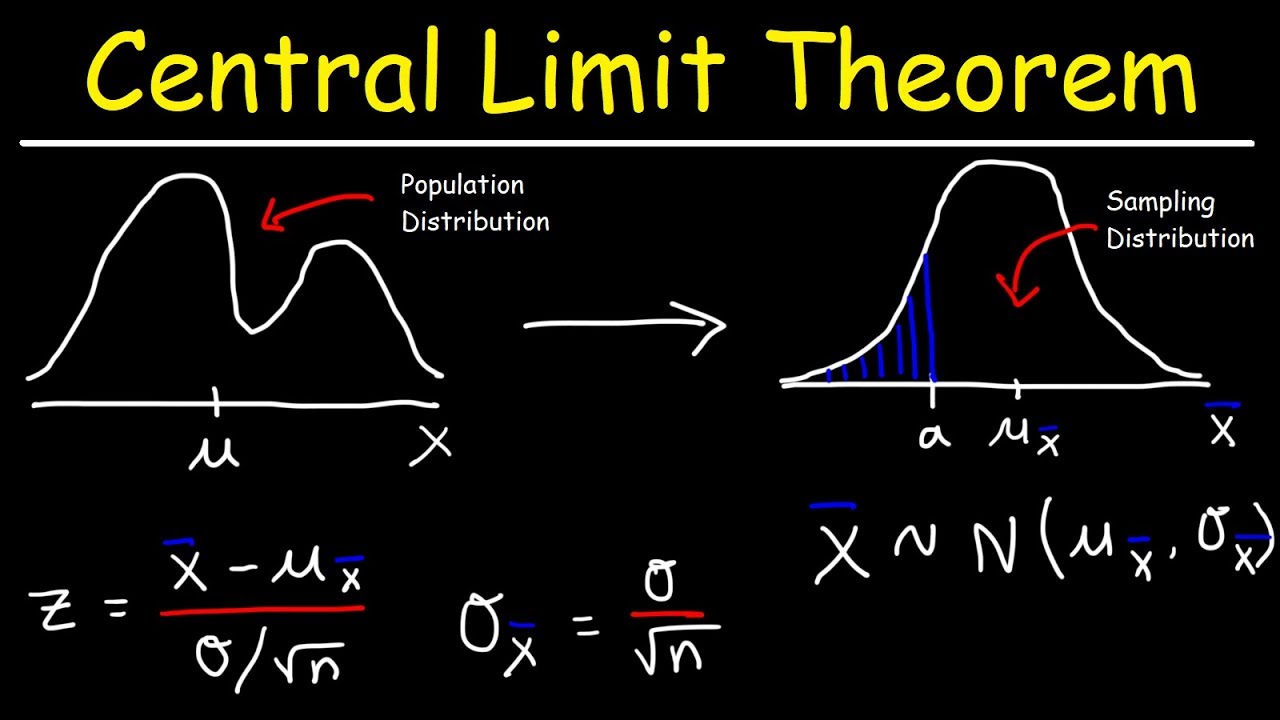
Central Limit Theorem - Sampling Distribution of Sample Means - Stats & Probability

01 - Sampling Distributions - Learn Statistical Sampling (Statistics Course)
5.0 / 5 (0 votes)
Thanks for rating: