Top 10 Tips for AP Statistics Unit 5 Sampling Distributions
TLDRThis video script offers a comprehensive overview of AP Statistics Unit 5, focusing on sampling distributions. It explains the concept of a sampling distribution as the model of all possible sample statistics from a given population. The script delves into describing sampling distributions, detailing the process for sample proportions and means, and the importance of meeting three key conditions for valid sampling distributions. It emphasizes the impact of sample size on accuracy and variation, and how sampling distributions are used to support or refute population parameters. The video aims to refresh viewers on these crucial concepts for their upcoming studies in subsequent units.
Takeaways
- 📚 Sampling Distributions are crucial for understanding statistical inference and are foundational for units 6 to 9 in AP Statistics.
- 🔍 A sampling distribution represents the distribution of all possible sample statistics from a given population, allowing us to model variability.
- 📈 The description of a sampling distribution involves its center, spread, and shape, which can vary depending on the type of distribution.
- 📝 For a sample proportion, the center is the population proportion (P), the spread is the standard deviation of the sample proportions, and the shape is normally distributed.
- 📉 When dealing with the difference in sample proportions, the center is the difference between population proportions, the spread involves a complex formula, and the shape is also normal.
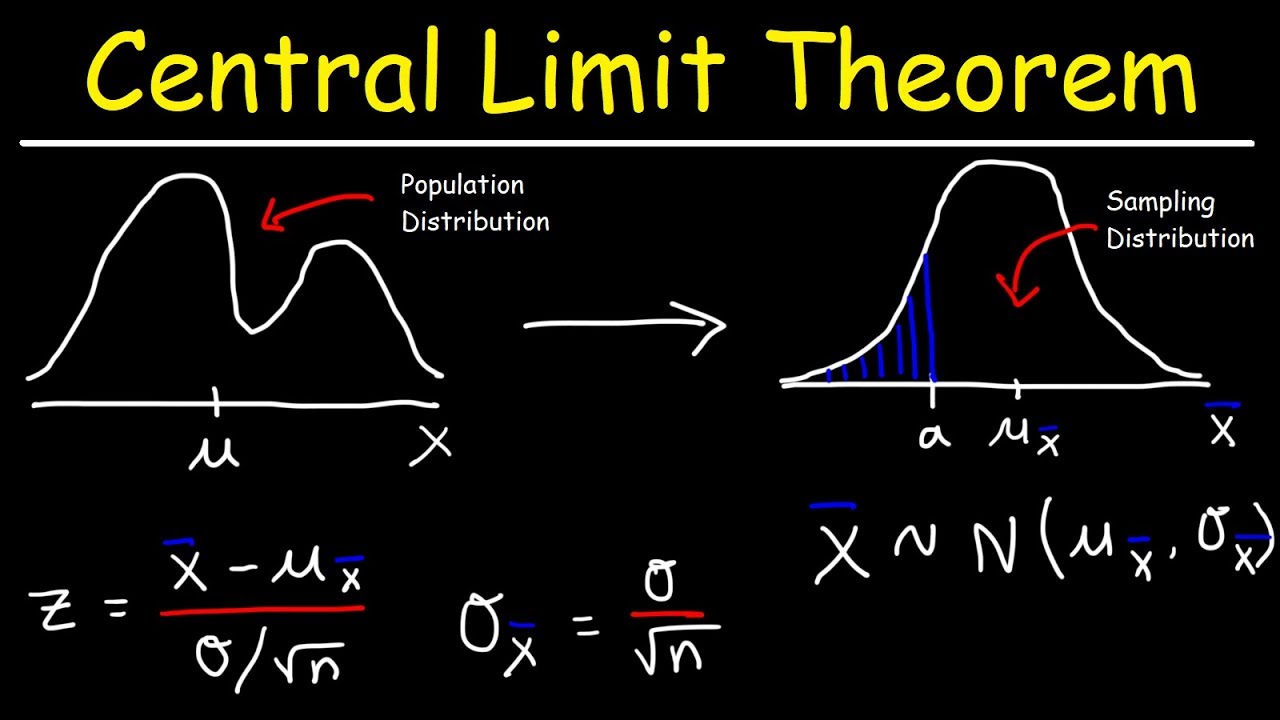
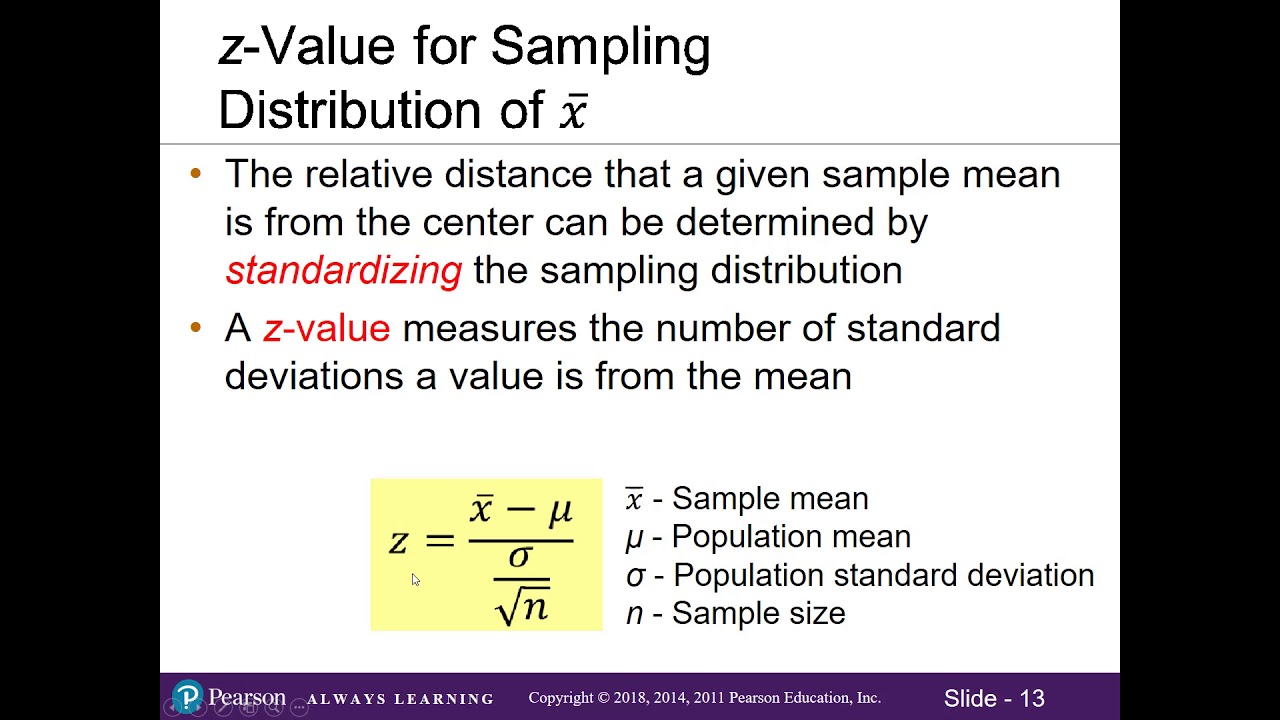
- 🔢 For sample means, the center is the population mean (mu), the spread is the population standard deviation divided by the square root of the sample size, and the shape is normal.
- ⚖️ The difference in two sample means has a center that is the difference between population means, a spread that requires a formula involving variances and sample sizes, and a normal shape.
- 🎯 Three key conditions for sampling distributions are: random selection to avoid bias, sample size being less than 10% of the population for independence, and 'big enough' samples for normal distribution assumptions.
- 📉 The 'big enough' condition differs for proportions, requiring at least 10 expected successes and failures, and for means, relying on the central limit theorem for sample sizes of 30 or more.
- 📊 Sample size significantly impacts the accuracy and variability of sample statistics, with larger samples providing less variability and more accurate estimates.
- 🧩 Finding probabilities of sample statistics involves calculating z-scores and using the standard normal model to determine the likelihood of a statistic occurring within a range.
- 🔎 Sampling distributions help in hypothesis testing by allowing us to determine if observed sample statistics support or refute the population parameters.
Q & A
What is a sampling distribution?
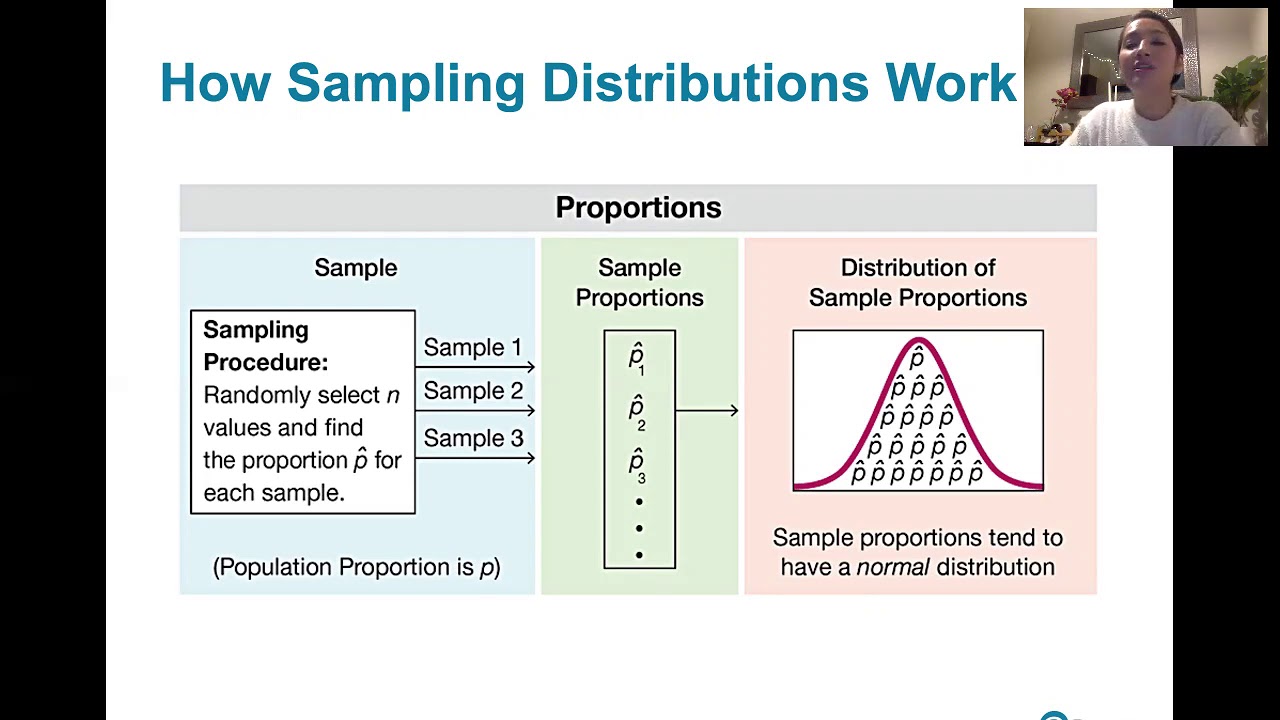
-A sampling distribution is the distribution or model of all possible sample statistics taken from all possible samples of size n from a given population.
What are the two most famous population parameters?
-The two most famous population parameters are the population mean and the population proportion.
What are the two most famous sample statistics?
-The two most famous sample statistics are the sample mean and the sample proportion.
When describing a sampling distribution, what three aspects should you mention?
-When describing a sampling distribution, you should mention the center, the spread, and the shape of the distribution.
What is the center of a sampling distribution for a sample proportion?
-The center of a sampling distribution for a sample proportion is the mean of all possible sample proportions, which is equal to the population proportion (P).
What is the spread of a sampling distribution for a sample proportion?
-The spread of a sampling distribution for a sample proportion is the standard deviation of all those sample proportions, calculated as the square root of P * (1 - P) divided by the sample size n.
What are the conditions that must be met to build a sampling distribution for sample means?
-The conditions include: the samples must be randomly selected to avoid bias, the sample size n must be less than 10% of the population to assume independence, and the sample size must be large enough (30 or more if the population is non-normal) for the sampling distribution to be normal.
How does sample size affect the accuracy of a sample mean or proportion?
-Bigger samples vary less and are more accurate, resulting in a smaller standard deviation. Smaller samples vary more and are less accurate.
What is the purpose of using z-scores in sampling distributions?
-Z-scores are used to find probabilities of a sample statistic occurring, such as the probability that a sample statistic is more than or less than a given value, or between two given values.
How do sampling distributions help in determining what supports or refutes a population parameter?
-Sampling distributions allow us to see what all possible sample statistics will look like and determine if a sample statistic is close to or extremely unlikely compared to the population parameter, thus supporting or refuting the parameter.
What is the significance of the central limit theorem in relation to sampling distributions for sample means?
-The central limit theorem states that the sampling distribution for a sample mean will be normal if the sample size is 30 or larger, regardless of the population's distribution shape.
Outlines
📚 Understanding Sampling Distributions
This paragraph introduces the concept of sampling distributions as a model of all possible sample statistics from a given population. It emphasizes the importance of sampling distributions in setting the foundation for further statistical learning in subsequent units. The key points include the definition of a sampling distribution, the distinction between population parameters and sample statistics, and the variability inherent in sample statistics. The paragraph also outlines the three main aspects to consider when describing a sampling distribution: its center, spread, and shape.
📊 Describing Sampling Distributions
This section delves into the specifics of describing sampling distributions, highlighting the need to construct a model that represents what all possible sample statistics could look like. The focus is on the three critical elements of a sampling distribution: the center, spread, and shape. The paragraph further explains how to build sampling distributions for sample proportions and the difference in sample proportions, detailing the formulas for calculating the mean, standard deviation, and the conditions under which the distribution will be normal.
🔍 Building Sampling Distributions for Sample Means
The third paragraph focuses on constructing sampling distributions for sample means. It outlines the process of determining the center, spread, and shape of the distribution. The center is identified as the mean of all possible sample means, which is equal to the true population mean. The spread is calculated as the standard deviation of the population divided by the square root of the sample size. The shape is consistently normal. Additionally, the paragraph discusses the construction of sampling distributions for the difference in two sample means, including the formulas for the mean and standard deviation of these differences.
🔗 Conditions for Sampling Distributions
This paragraph discusses the three essential conditions that must be met for sampling distributions to be valid. First, samples must be randomly selected to avoid bias. Second, the sample size must be less than 10% of the population to assume independence. Third, the sample must be large enough, with different criteria for proportions and means. For proportions, the sample must contain at least 10 expected successes and failures. For means, the central limit theorem states that a sample size of 30 or larger will result in a normal sampling distribution, regardless of the population's shape.
🔢 Importance of Sample Size in Sampling Distributions
The fifth paragraph emphasizes the impact of sample size on the variability of sampling distributions. Larger samples result in less variability, as indicated by a smaller standard deviation. This is crucial for obtaining more accurate sample proportions or means. The paragraph also explains that the standard deviation formulas for the four different sampling distributions all include the sample size in the denominator, reinforcing the idea that bigger samples lead to more precise estimates.
🎯 Finding Probabilities in Sampling Distributions
This section explains how to find probabilities of a sample statistic occurring within a sampling distribution. It outlines the process of calculating z-scores to determine the probability that a sample statistic is more than, less than, or between given values. The key is to use the mean and standard deviation of the specific type of sampling distribution to calculate the z-score, and then use the standard normal model to find the probability.
🔍 Sampling Distributions as a Tool for Validation
The final paragraph highlights the role of sampling distributions in validating or refuting population parameters. It explains that the central value of a sampling distribution represents the known or believed population parameter. Sample statistics that fall near this central value support the parameter, while those that are extremely high or low refute it. This process is crucial for determining the accuracy of population parameters and is a key concept in subsequent statistical units.
Mindmap
Keywords
💡Sampling Distribution
💡Population Parameter
💡Sample Statistic
💡Sample Proportion
💡Sample Mean
💡Standard Deviation
💡Normal Distribution
💡Z-Score
💡Central Limit Theorem
💡Independence
💡Random Sampling
Highlights
Sampling distributions are the distribution or model of all possible sample statistics taken from all possible samples of size n from a given population.
A population parameter is any numerical summary of a population, commonly the population mean or proportion.
Sample statistics, like the sample mean or proportion, vary because each sample produces its own statistic.
A sampling distribution shows what all possible sample statistics could look like from a given sample size taken from a given population.
To describe a sampling distribution, mention its center, spread, and shape.
For sample proportions, the center is the population proportion, the spread is the standard deviation of sample proportions, and the shape is normal.
For the difference in sample proportions, the center is the difference between population proportions, the spread involves a complex formula, and the shape is normal.
For sample means, the center is the population mean, the spread is the standard deviation of sample means, and the shape is normal.
For the difference in sample means, the center is the difference between population means, the spread involves a formula with standard deviations, and the shape is normal.
Three important conditions for sampling distributions: samples must be randomly selected, sample size must be less than 10% of the population, and the sample must be big enough.
Big enough samples for proportions need at least 10 expected successes and 10 expected failures.
Big enough samples for means need a sample size of 30 or larger if the population is nonnormal.
Larger sample sizes reduce variability, making sample statistics more accurate.
Probabilities of sample statistics can be found using z-scores and the standard normal model.
Sampling distributions help determine what sample statistics support or refute the population parameter.
Transcripts
Browse More Related Video

WHAT IS A "SAMPLING DISTRIBUTION" and how is it different from a "sample distribution"... and stuff
6.3.0 Sampling Distributions and Estimators - Lesson Overview, Learning Outcomes and Key Concepts
6.3.1 Sampling Distributions and Estimators - Sampling Distributions Described and Defined
Sampling Distributions: Introduction to the Concept
Central Limit Theorem - Sampling Distribution of Sample Means - Stats & Probability
7.2 Sampling Distribution of the Mean (Updated)
5.0 / 5 (0 votes)
Thanks for rating: