7.2 Sampling Distribution of the Mean (Updated)
TLDRThis educational video script delves into the concept of sampling distributions and their importance in statistics. It explains how to calculate the mean and standard deviation for a sampling distribution, emphasizing the significance of the Central Limit Theorem. The script outlines theorems that govern the behavior of sample means, including their average value and standard deviation, and discusses the conditions under which the sampling distribution of the sample mean is normally distributed. It also covers how to standardize a sampling distribution into Z values and demonstrates the process of finding probabilities using Excel, providing a practical approach to understanding statistical distributions.
Takeaways
- 📚 The video introduces concepts of sampling distributions and how to calculate mean and standard deviation for a sample's sampling distribution.
- 📈 It emphasizes the importance of the Central Limit Theorem (CLT) in understanding the behavior of sampling distributions.
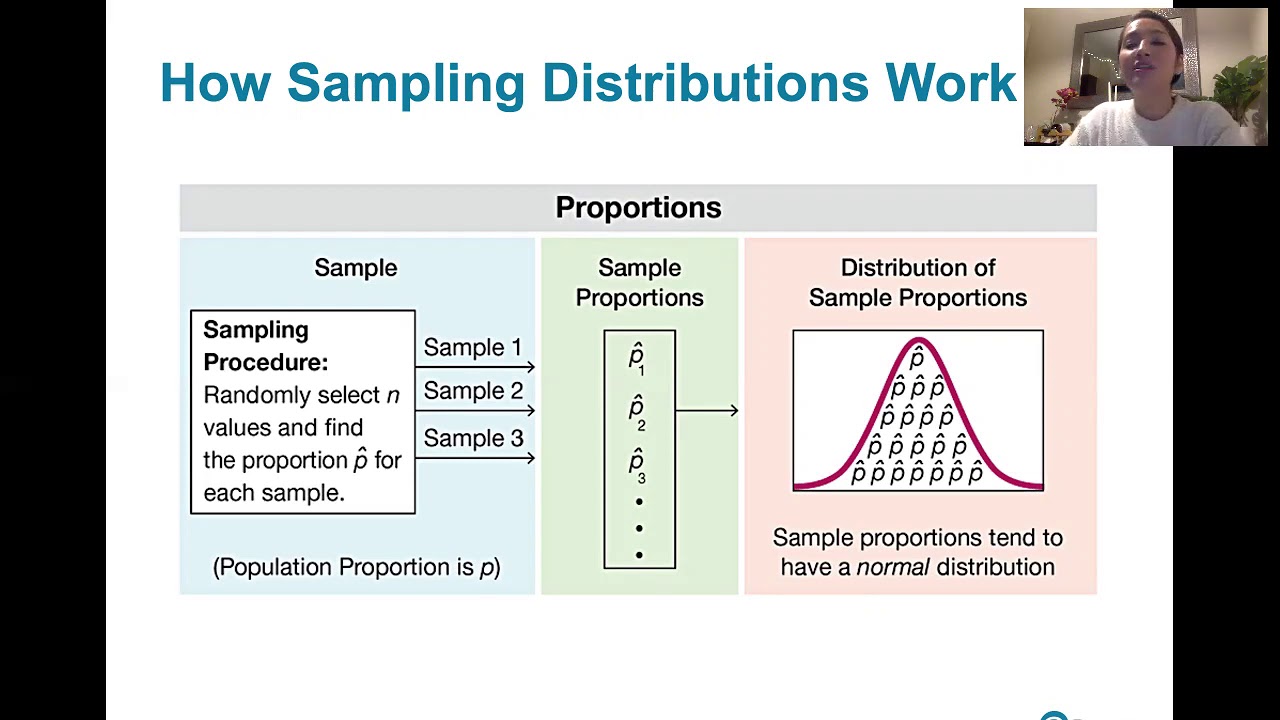
- 📊 The script explains that a sampling distribution can be visualized as a histogram of all possible sample means from a given population.
- 🔢 The average value of sample means is equal to the population mean, as per the first theorem discussed in the video.
- 📉 The standard deviation of sample means, also known as the standard error, is the population standard deviation divided by the square root of the sample size (n).
- 📚 The video clarifies that if the population is normally distributed, the sampling distribution of the sample mean is also normally distributed, under certain conditions.
- 🧩 The CLT states that the sampling distribution of the sample mean will be approximately normal if the sample size is large enough, regardless of the population's distribution shape.
- 🔑 A 'sufficiently large' sample size for the CLT to apply is generally considered to be n ≥ 30, especially for populations that are not symmetric or normally distributed.
- 📐 The video demonstrates how to convert sample means into Z values to standardize the sampling distribution, which is useful for probability calculations.
- 📝 An example problem is worked through, illustrating the process of calculating the probability that a sample mean will exceed a certain value using the Z value and Excel.
- 🔍 The video provides formulas and Excel functions for finding probabilities associated with sample means, including the use of the NORMDIST and 1-NORMDIST functions.
Q & A
What is the main focus of the video script?
-The video script focuses on explaining the concepts of sampling distributions, how to calculate the mean and standard deviation for a sampling distribution, and the importance of the Central Limit Theorem.
What is a sampling distribution?
-A sampling distribution is the probability distribution of a given statistic (such as the sample mean) based on a random sample of a certain size taken from a population.
What are the three theorems discussed in the script related to sampling distributions?
-The three theorems are: 1) The average value of sample means is the same as the population mean, 2) The standard deviation of sample means (also known as standard error) is the population standard deviation divided by the square root of the sample size, and 3) If a population is normally distributed, the sampling distribution of the sample mean is also normally distributed.
What is the Central Limit Theorem and why is it significant?
-The Central Limit Theorem states that regardless of the shape of the population distribution, if the sample size is sufficiently large, the sampling distribution of the sample mean will be approximately normally distributed. This is significant because it simplifies the process of finding probabilities of events by allowing us to work with the normal distribution.
What is meant by 'sufficiently large sample size' in the context of the Central Limit Theorem?
-A 'sufficiently large sample size' refers to a sample size that is large enough to ensure that the sampling distribution of the sample mean is approximately normally distributed. A conservative definition is when the sample size n is greater than or equal to 30.
How can we convert X values into Z values in the context of sampling distributions?
-X values can be converted into Z values by using the Z value formula, which measures how many standard deviations a particular value is away from the mean. The formula involves subtracting the population mean from the sample mean and dividing by the standard error (population standard deviation divided by the square root of the sample size).
How does the population's distribution shape affect the sampling distribution of the sample mean?
-If the population is normally distributed (bell-shaped), the sampling distribution of the sample mean will also be normally distributed. If the population is not normally distributed, the sampling distribution of the sample mean will be approximately normally distributed if the sample size is sufficiently large, according to the Central Limit Theorem.
What is the formula used to calculate the probability of a sample mean exceeding a certain value?
-The formula used is based on the Z value of the sample mean. After calculating the Z value, Excel can be used to find the probability using the normdist function for less than statements or 1 - normdist for greater than statements, with the Z value and 'true' for cumulative probability.
What is the difference between the standard deviation of a population and the standard error of sample means?
-The standard deviation of a population is a measure of the dispersion of the individual observations within the population. The standard error of sample means is the standard deviation of the sampling distribution of the sample mean, which is calculated as the population standard deviation divided by the square root of the sample size.
Can you provide an example of how to calculate the probability that a sample mean will exceed a certain value using the information from the script?
-Yes, given a normally distributed population with a mean of 2000 and a standard deviation of 230, and a random sample size of 8, the probability that the sample mean will exceed 2100 can be calculated by first finding the Z value using the formula (sample mean - population mean) / (population standard deviation / sqrt(sample size)), then using Excel to find the probability with the normdist function for the complement of the Z value.
Outlines
📊 Understanding Sampling Distributions and Central Limit Theorem
This paragraph introduces the concept of sampling distributions, explaining how the mean and standard deviation of a sample mean's distribution can be calculated. It emphasizes the importance of the Central Limit Theorem (CLT) and connects it to previous knowledge of frequency distributions and histograms. The CLT is particularly highlighted for its utility in simplifying the understanding of various population distributions by approximating them as normal distributions when sample sizes are large enough. The paragraph also outlines several theorems that describe the behavior of sample means and their standard deviations, setting a foundation for further statistical analysis.
🔢 Calculating Probabilities with Sampling Distributions and Z-Values
This section delves into the practical application of the concepts introduced earlier, specifically focusing on calculating the probability of a sample mean exceeding a certain value. It provides a step-by-step guide on how to use the Z-value formula to standardize a sample mean and then use Excel functions to find the associated probability. The explanation includes an example problem where a normally distributed population with a known mean and standard deviation is used to find the probability that a sample mean will exceed 2100. The process involves defining the event of interest, calculating the standard error, finding the Z-value, and finally using Excel to determine the probability, which in this case is approximately 10.93%.
📘 Excel Techniques for Z-Value Calculation and Probability Determination
The final paragraph provides a detailed explanation of how to use Excel to calculate Z-values and determine probabilities for sample means, which can also be applied to proportions. It offers two Excel formulas, 'NORMDIST' for less than statements and '1-NORMDIST' for greater than statements, and explains how to apply the complement rule when dealing with probabilities of events exceeding certain values. The paragraph also includes a reminder of the correct order of operations when entering data into Excel formulas to avoid errors. Additionally, it presents an alternative method of using Excel's 'STANDARDIZED' function to directly calculate Z-values, streamlining the process and ensuring accuracy.
Mindmap
Keywords
💡Sampling Distribution
💡Mean
💡Standard Deviation
💡Central Limit Theorem
💡Population
💡Sample Size (n)
💡Normal Distribution
💡Standard Error
💡Z Value
💡Excel
Highlights
Introduction to the concept of sampling distributions and their importance in statistics.
Explanation of how to calculate the mean and standard deviation for a sampling distribution.
Discussion on the central limit theorem and its significance in statistical analysis.
Understanding the relationship between the sample mean and the population mean through theorems.
Clarification that the average value of sample means equals the population mean.
Introduction of the standard deviation of sample means, also known as the standard error.
Theorem stating that the sampling distribution of the sample mean is normally distributed if the population is normal.
Description of the central limit theorem's role in simplifying the process of finding probabilities of events.
Requirement for a sufficiently large sample size to approximate a normal distribution for the sampling distribution of means.
The impact of population distribution shape on the required sample size for a normal approximation.
Conversion of X values into Z values for standardization in the context of sampling distributions.
Use of Excel to find probabilities associated with Z values in sampling distributions.
Step-by-step guide on calculating the probability that a sample mean exceeds a certain value.
Explanation of the complement rule in Excel for calculating probabilities of 'greater than' events.
Demonstration of how to use Excel functions to find the Z value of a sample mean.
Importance of ensuring the correct order of operations when calculating Z values.
Guidance on using Excel for standardized calculations related to sampling distributions.
Differentiation between using Excel for means versus proportions in sampling distributions.
Offer for assistance with any questions related to the content of the video.
Transcripts
Browse More Related Video
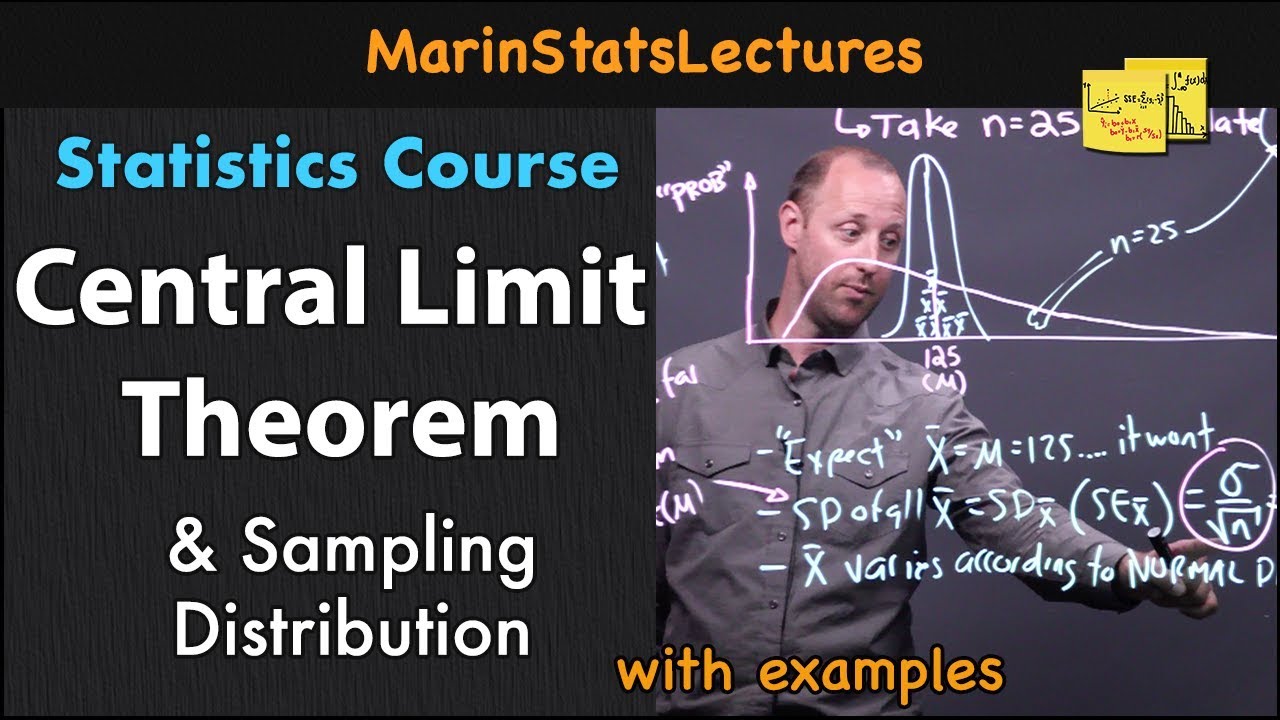
Central Limit Theorem & Sampling Distribution Concepts | Statistics Tutorial | MarinStatsLectures

Sampling Distributions (7.2)
The Sampling Distribution of the Sample Mean

Sampling distribution of the sample mean 2 | Probability and Statistics | Khan Academy
6.3.1 Sampling Distributions and Estimators - Sampling Distributions Described and Defined

WHAT IS A "SAMPLING DISTRIBUTION" and how is it different from a "sample distribution"... and stuff
5.0 / 5 (0 votes)
Thanks for rating: