6.3.1 Sampling Distributions and Estimators - Sampling Distributions Described and Defined
TLDRThis video script delves into the concept of sampling distributions and their importance in statistical learning. It explains what an estimator is and how sample statistics like proportions, means, and variances are used to estimate population parameters. The script clarifies that an unbiased estimator's sampling distribution mean equals the population parameter, using examples of normally distributed sample proportions and means. It emphasizes the simplicity of calculations when sampling with replacement and introduces the 'five percent rule' for determining whether sampling with or without replacement significantly affects results.
Takeaways
- 📚 The video discusses learning outcomes from a lesson on sampling and the characteristics of a sampling distribution.
- 🔍 An estimator is a sample statistic used to estimate the value of a population parameter, such as sample proportion (p-hat), sample mean (x-bar), and sample variance.
- 🎯 The mean of the sampling distribution of a statistic should be equal to the corresponding population parameter for it to be a good estimator.
- 📉 The sampling distribution of a statistic is the distribution of all possible values of that statistic when all possible samples of the same size are taken from the same population.
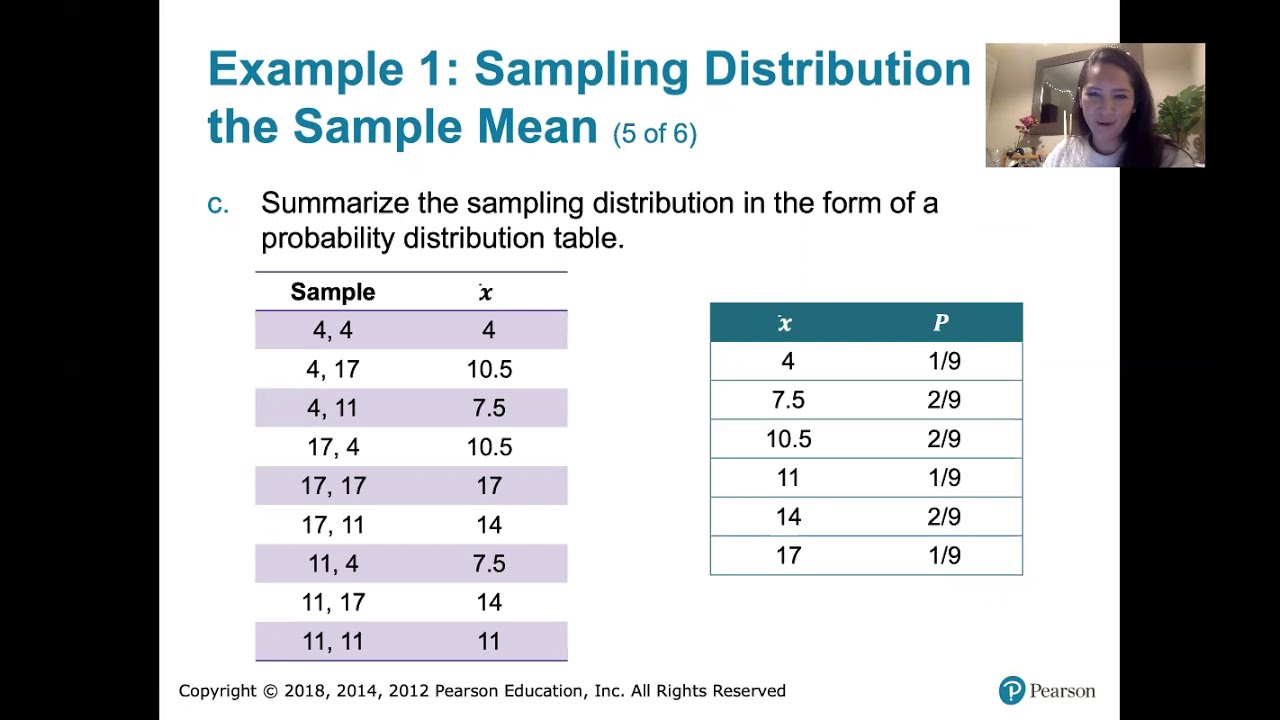
- 📊 The sampling distribution is typically represented as a probability distribution, which can be shown in a table, histogram, or formula.
- 🌐 Sample proportions (p-hat) from different samples tend to be normally distributed and have a mean equal to the population proportion (p), making p-hat an unbiased estimator.
- 📈 The mean of the sampling distribution of sample means (x-bars) is equal to the population mean (mu), indicating that the sample mean is also an unbiased estimator.
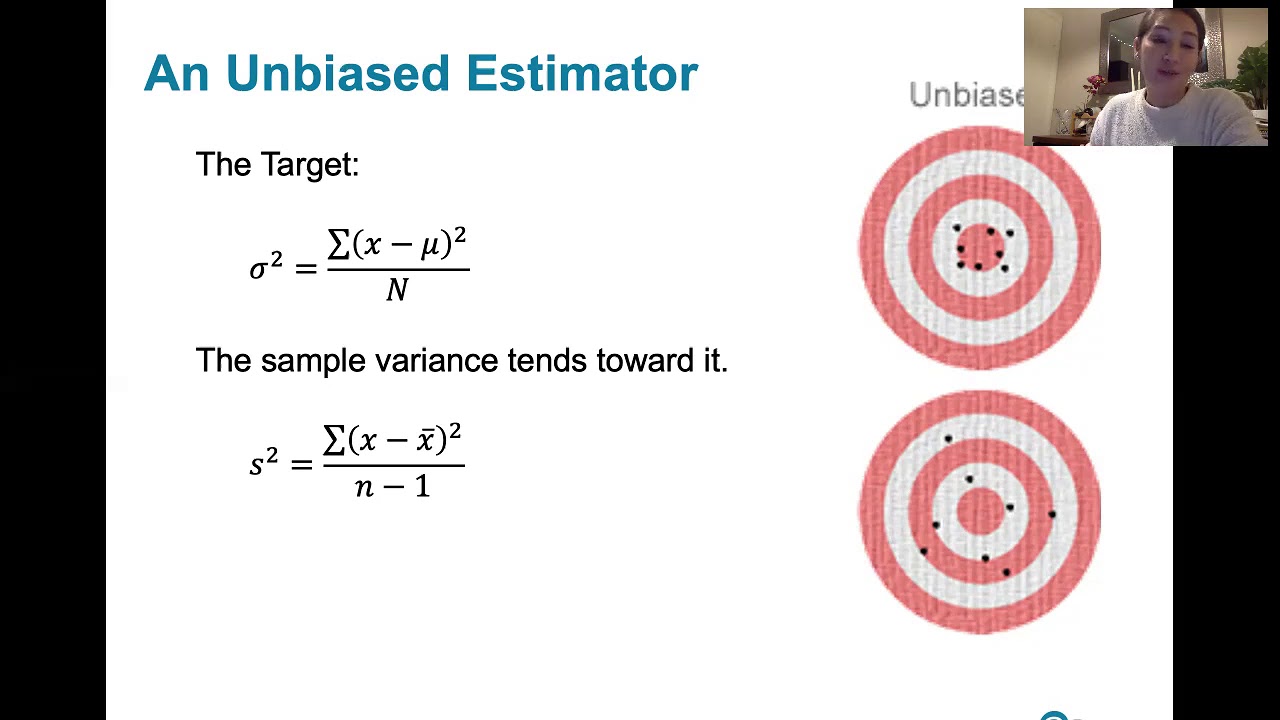
- 📊 The distribution of sample variances tends to be skewed to the right but still has an expected value equal to the population variance, making it an unbiased estimator.
- 🔄 Sampling with replacement is preferred for ease of calculations and because it treats each selection as an independent event.
- 📝 The 'five percent rule' suggests that for relatively small samples from a large population, sampling with or without replacement makes no significant difference in calculations.
- 📚 The concepts will be solidified through homework and practical examples, emphasizing the importance of understanding sampling distributions and unbiased estimators.
Q & A
What is the main topic of the video script?
-The main topic of the video script is sampling distributions, specifically discussing what they are, how they are constructed, and why they are important in statistics.
What is a statistic in the context of this video?
-A statistic is a value associated with a sample taken from a population, such as a sample proportion (p-hat), sample mean (x-bar), sample standard deviation, or sample variance.
What is an estimator in statistics?
-An estimator is a sample statistic used to infer or estimate the value of a population parameter. It is a tool to make inferences about the population based on the sample.
Why are we interested in sampling distributions?
-We are interested in sampling distributions because they help us understand how different sample statistics vary and how they can be used to estimate population parameters.
What does it mean for a sample statistic to have a mean equal to the corresponding population parameter?
-If the mean of the distribution of a sample statistic is equal to the corresponding population parameter, it means that the sample statistic is an unbiased estimator of that parameter.
What is the sampling distribution of a statistic?
-The sampling distribution of a statistic is the distribution of all possible values that the statistic can take when all possible samples of the same size are drawn from the same population.
Why are sample proportions considered to be normally distributed?
-Sample proportions tend to be normally distributed due to the Central Limit Theorem, which states that the distribution of sample proportions will approach a normal distribution as the sample size increases.
What is the expected value of the sample proportion (p-hat) in relation to the population proportion (p)?
-The expected value of the sample proportion (p-hat) is equal to the population proportion (p), making p-hat an unbiased estimator of p.
What is the difference between an unbiased and a biased estimator?
-An unbiased estimator has a mean (or expected value) equal to the population parameter it is estimating, while a biased estimator does not; its mean is not equal to the population parameter.
Why do we sample with replacement?
-We sample with replacement to ensure that each selection is an independent event, simplifying calculations and making the formulas for distributions easier to work with.
What does the 'five percent rule' refer to in the context of sampling with or without replacement?
-The 'five percent rule' suggests that when the sample size is less than or equal to 5% of the population size, the difference between sampling with and without replacement is negligible, and thus sampling with replacement can be used for simplicity.
How does the distribution of sample variances differ from that of sample means?
-Sample variances tend to have a skewed distribution with a long right tail, unlike sample means which tend to have a normal distribution. However, the expected value of sample variances is still equal to the population variance, making them unbiased estimators.
Outlines
📚 Understanding Sampling Distributions and Estimators
This paragraph introduces the concept of sampling distributions and the role of estimators in statistics. It explains that a statistic, such as a sample proportion (p-hat), mean (x-bar), or standard deviation, is used to estimate the corresponding population parameter. The importance of whether the mean of the sampling distribution of a statistic equals the population parameter is highlighted, as this determines if the statistic is an unbiased estimator. The paragraph uses the normal distribution of sample proportions as an example to illustrate the concept of an unbiased estimator, where the expected value of p-hat is equal to the population proportion p.
🔍 Biased vs. Unbiased Estimators in Sampling
The second paragraph delves into the terminology of biased and unbiased estimators. It clarifies that if the mean of the sampling distribution of a statistic matches the population parameter, the statistic is considered unbiased, as it accurately targets the parameter we wish to estimate. Conversely, if the mean does not match, the statistic is biased, which is generally not desirable for estimation purposes. The paragraph also discusses the process of sampling with replacement and its advantages in simplifying calculations, especially when dealing with large populations and small sample sizes, referencing the 'five percent rule' for when sampling with or without replacement becomes significantly different.
📈 The Normal Distribution of Sample Means and Variances
This paragraph focuses on the normal distribution of sample means and variances when samples are drawn with replacement from a population. It explains that the mean of the sample means equals the population mean, making it an unbiased estimator. The discussion extends to sample variances, which, despite tending to have a skewed distribution, still have an expected value equal to the population variance, thus also being unbiased estimators. The importance of this understanding is emphasized for completing homework and grasping the concept through practical application.
📝 Summarizing the Concept of Sampling Distributions
The final paragraph summarizes the concept of sampling distributions, which are the distributions of all possible values of a statistic obtained from samples of the same size drawn from the same population. It emphasizes that these distributions are typically represented as probability distributions and are crucial for comparing the mean of the sampling distribution to the population parameter to determine if the statistic is an unbiased estimator. The paragraph concludes by encouraging students to apply these concepts in their homework and to review the material after completing the assignments for a deeper understanding.
Mindmap
Keywords
💡Sampling
💡Sample Statistic
💡Estimator
💡Population Parameter
💡Sampling Distribution
💡Unbiased Estimator
💡Biased Estimator
💡Normal Distribution
💡Sample Proportion
💡Sample Variance
💡Sampling with Replacement
💡Five Percent Rule
Highlights
The video discusses learning outcome number one from lesson 6.3, focusing on sampling and the distribution of sample statistics.
The goal is to understand the characteristics of a sampling distribution and their importance in statistical inference.
An estimator is introduced as a sample statistic used to infer or estimate the value of a population parameter.
Examples of estimators include sample proportion (p-hat), sample mean (x-bar), and sample standard deviation.
The mean of the distribution of a sample statistic should ideally equal the corresponding population parameter.
The sampling distribution of a statistic is the distribution of all values of the statistic from all possible samples of the same size.
The sampling distribution of sample proportions (p-hat) is normally distributed and has a mean equal to the population proportion (p).
An unbiased estimator is one where the mean of its sampling distribution equals the corresponding population parameter.
A biased estimator does not target the population parameter accurately, as its expected value differs from the parameter.
Sampling with replacement is preferred for ease of calculation and maintaining the independence of each selection.
The five percent rule is mentioned, indicating that sampling with or without replacement makes no significant difference for small samples from large populations.
The sampling distribution of sample means (x-bar) is also normally distributed with a mean equal to the population mean (mu).
The sampling distribution of sample variances tends to be skewed to the right but still has an expected value equal to the population variance.
The video emphasizes the importance of understanding sampling distributions for various statistics such as proportions, means, and variances.
The video suggests that completing the homework and revisiting the video after will solidify the concepts discussed.
Concrete examples in the homework will help demystify the concepts of sampling distributions and estimators.
Transcripts
Browse More Related Video
6.3.3 Sampling Distributions and Estimators - Sampling Distribution of the Sample Means

WHAT IS A "SAMPLING DISTRIBUTION" and how is it different from a "sample distribution"... and stuff
Top 10 Tips for AP Statistics Unit 5 Sampling Distributions
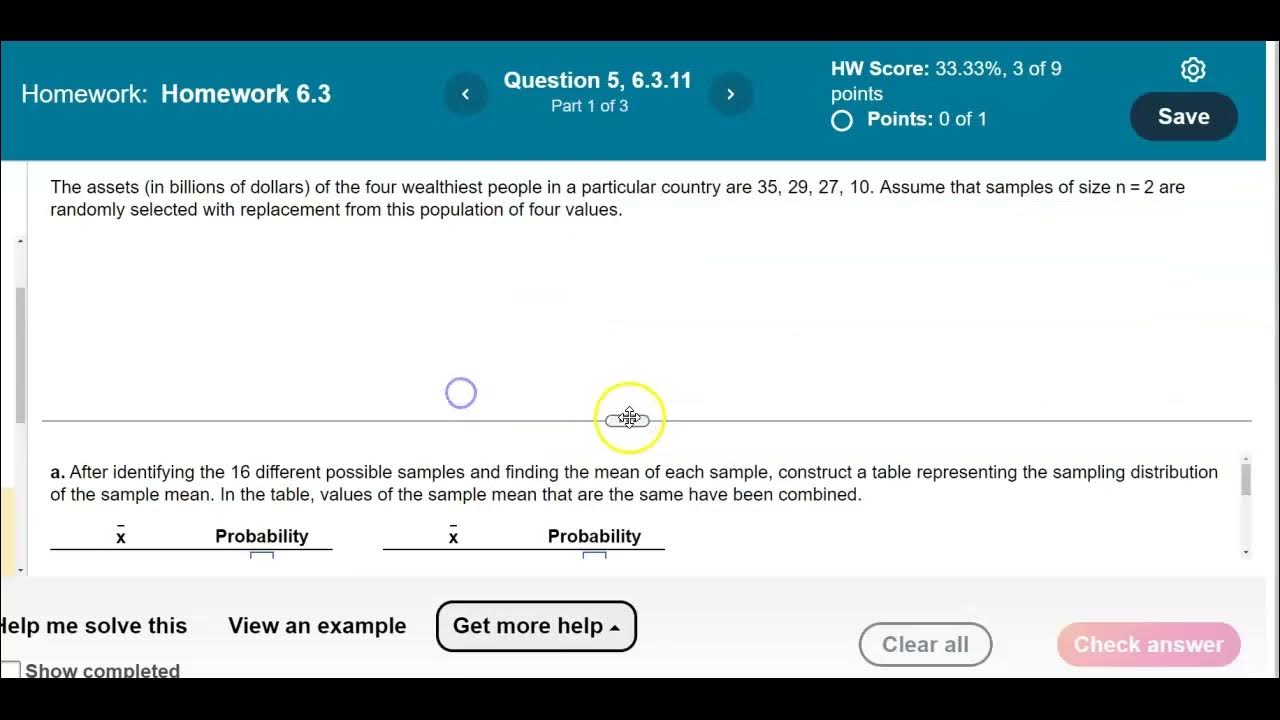
Math 14 HW 6.3.11 Is a sample mean an unbiased estimator of the population mean?
Sampling Distributions: Introduction to the Concept
6.3.5 Sampling Distributions and Estimators - Biased and Unbiased Estimators
5.0 / 5 (0 votes)
Thanks for rating: