Variance and Standard Deviation: Why divide by n-1?
TLDRIn the video, Justin Zeltser delves into the concepts of variance and standard deviation, using a dataset of weekly expenditures as an example. He explains the formulas for mean, variance, and standard deviation, and addresses common questions about why we use these statistical measures. Zeltser clarifies the reason for squaring deviations in variance calculation and the rationale behind dividing by n-1, which accounts for the sample mean's estimation of the population mean. He also introduces the concept of degrees of freedom, illustrating it with examples to help viewers understand the difference between population and sample variance.
Takeaways
- 📊 Variance and standard deviation are important statistical concepts that help in understanding the spread of a data set.
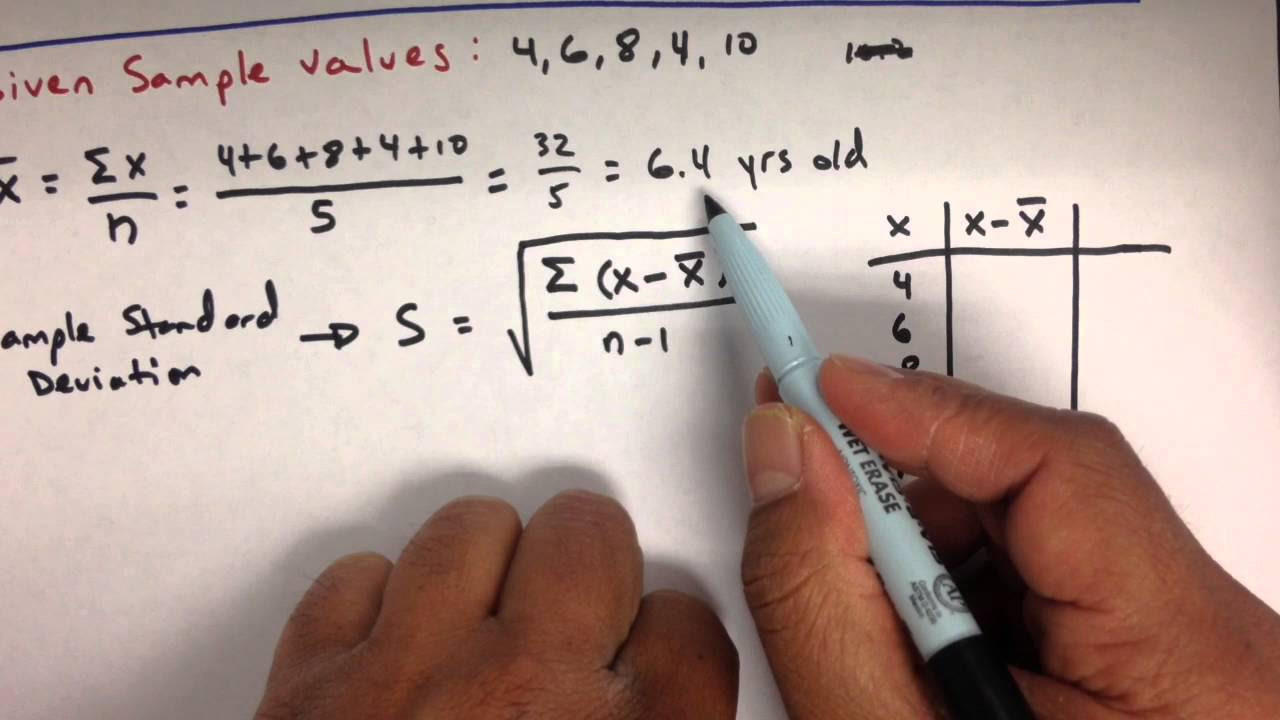
- 🧮 Mean is calculated as the sum of all observations divided by the number of observations.
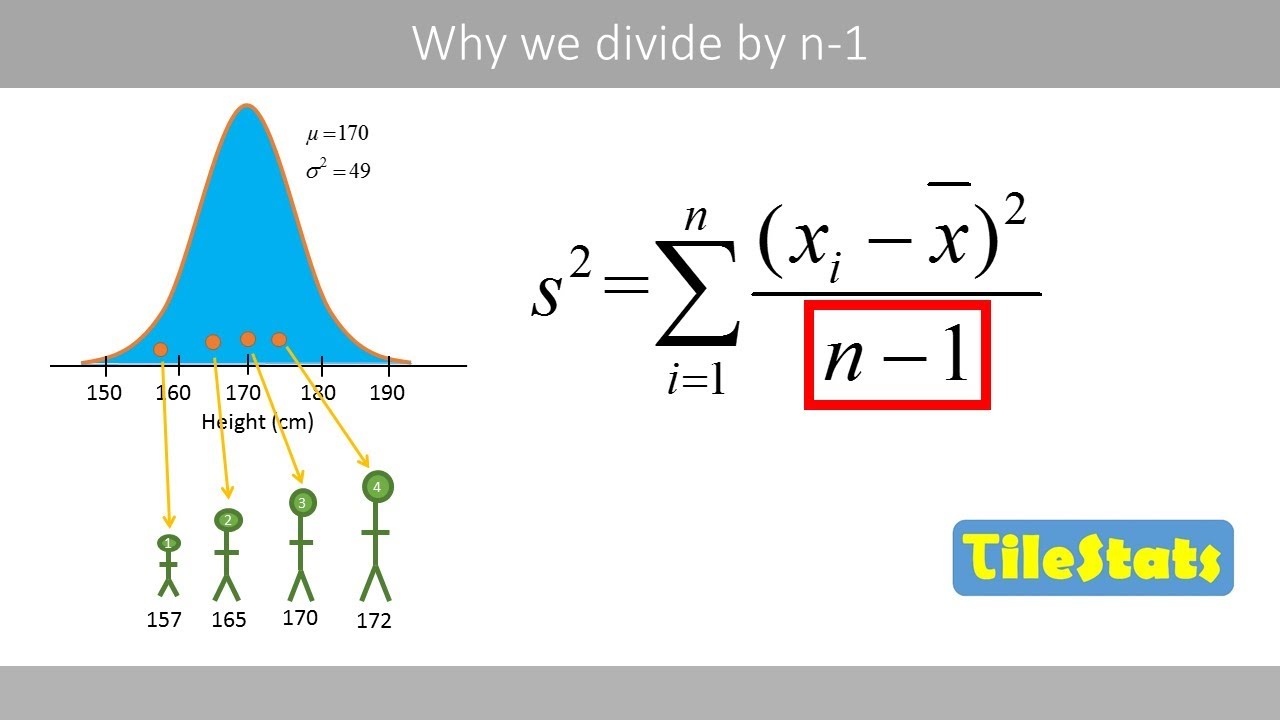
- 📈 Variance is calculated by taking the squared deviations from the mean, summing them up, and dividing by the number of observations minus one.
- 🌐 Standard deviation is the square root of the variance and provides a more intuitive measure of spread.
- 🤔 The reason for squaring deviations in variance calculation is to make all deviations positive and to be compatible with higher-order statistical moments.
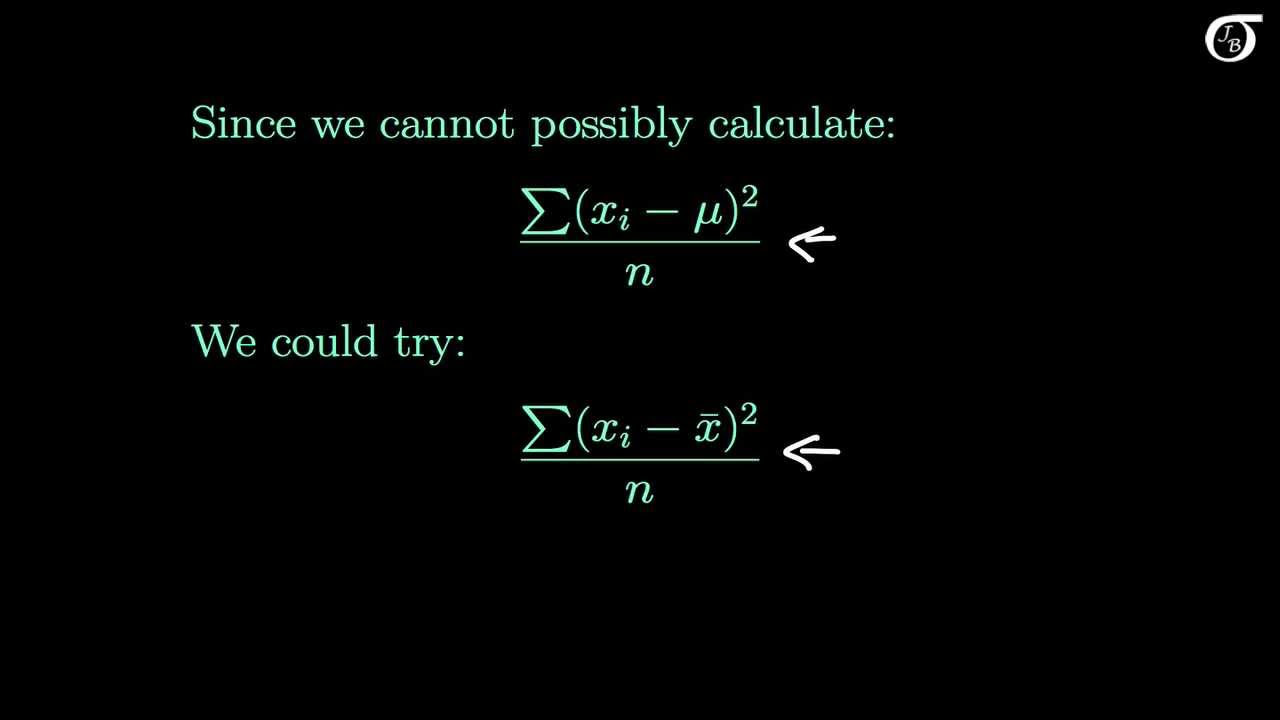
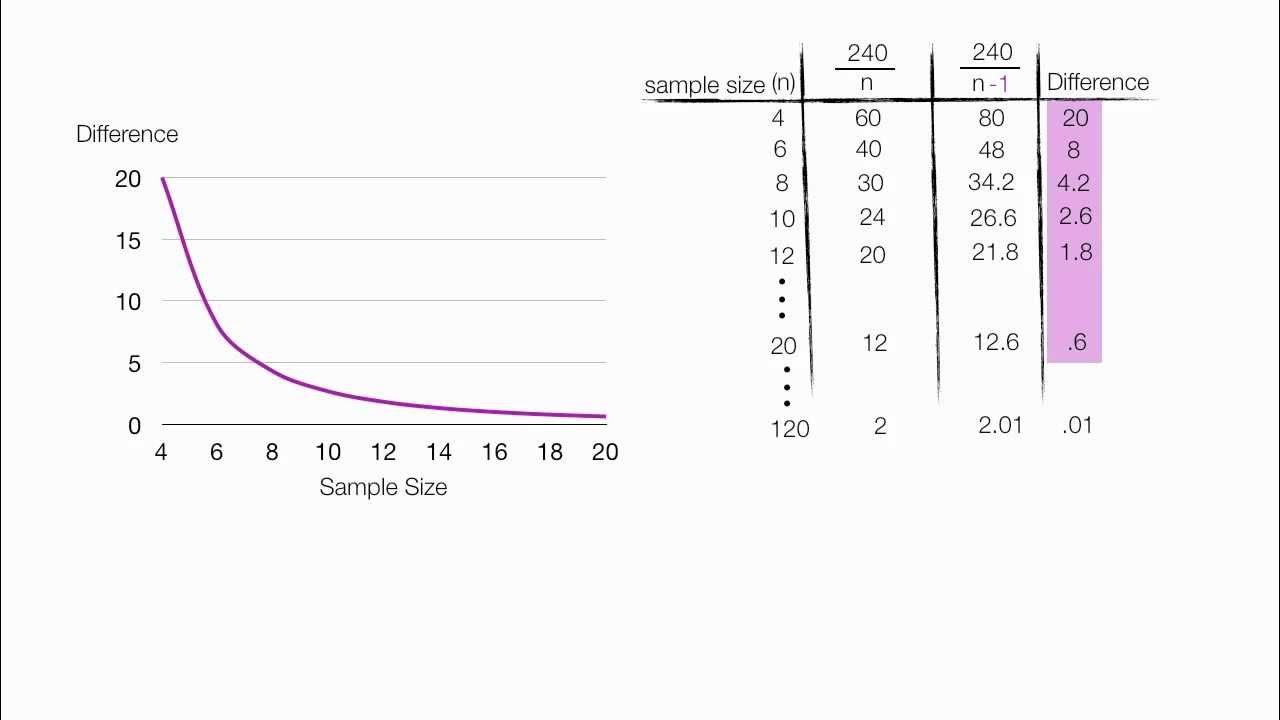
- 🔄 Dividing by n-1 instead of n in variance calculation adjusts the estimate upwards to account for the sample mean being an approximation of the population mean.
- 🔢 The concept of degrees of freedom is crucial in statistics and represents the number of independent pieces of information in a data set.
- 🔄 In a population data set, each observation is independent, whereas in a sample data set, the third observation is determined by the first two to ensure the sum of deviations equals zero.
- 📉 The population variance formula divides by the total number of observations (n), while the sample variance formula divides by n minus one.
- 📚 Understanding variance, standard deviation, and degrees of freedom is essential for accurate statistical analysis and interpretation of data.
Q & A
What is the main topic of the video?
-The main topic of the video is to provide a deeper understanding of variance and standard deviation, and to address common questions related to these statistical concepts.
What data set is used in the video to illustrate the concepts?
-The video uses a data set of weekly expenditure on petrol over 12 weeks to illustrate the concepts of mean, variance, and standard deviation.
How is the mean calculated for the given data set?
-The mean is calculated by summing up all the observations and dividing by the number of observations, which in this case is 12.
Why is the variance calculated by squaring the deviations from the mean?
-Squaring the deviations from the mean allows for a positive value regardless of the direction of the deviation, which helps in measuring the spread of the data set without being affected by the sign of the deviation.
What is the purpose of the standard deviation in statistics?
-The standard deviation provides an intuitive measure of the spread of a data set. It is the square root of the variance and is more understandable in the context of the data's scale.
Why is the variance calculated using n minus 1 instead of n in the formula?
-The variance is calculated using n minus 1 to adjust for the fact that the sample mean is used as an estimate of the population mean. This adjustment, known as Bessel's correction, provides an unbiased estimate of the population variance.
What is the significance of the concept of degrees of freedom in statistics?
-Degrees of freedom represent the number of independent pieces of information in a data set. It is related to the number of values that can vary freely when calculating statistics such as the sample variance.
How does the concept of degrees of freedom relate to the calculation of variance?
-In the calculation of variance, the degrees of freedom are equal to the number of observations minus one. This accounts for the loss of one degree of freedom when estimating the population mean with the sample mean.
What is the difference between population variance and sample variance?
-Population variance is calculated using the entire population (n), while sample variance is calculated using a sample (n minus 1). The sample variance is adjusted to account for the estimation of the population mean using the sample mean.
Why is it important to understand the concepts of variance and standard deviation?
-Understanding variance and standard deviation is important as they provide insights into the variability and spread of data, which are crucial for making informed decisions and predictions in statistical analysis.
What is the role of the moments in the study of statistics?
-Moments in statistics are measures that describe the shape of the distribution of a data set. The variance is the second moment and is part of a larger study of moments that includes higher-order moments like the third and fourth moments, which involve cubing and raising deviations to the power of four, respectively.
Outlines
📊 Introduction to Variance and Standard Deviation
This paragraph introduces the concepts of variance and standard deviation, with the speaker, Justin Zeltser, planning to delve deeper into these statistical measures. He mentions having formulas for mean, variance, and standard deviation at hand and plans to use a dataset of weekly expenditure on petrol to illustrate these concepts. The speaker aims to make the topic more relatable by changing the dataset to weekly expenditure on gold and gay times. The mean is explained as the sum of all observations divided by the number of observations, with a formula that involves summing up all elements of the variable X.
🧮 Calculation and Purpose of Variance
In this paragraph, the speaker explains the calculation of variance, which involves finding the individual deviations from the mean for each observation, squaring them, and then summing these squared deviations. The speaker notes that the variance is divided by n minus 1, a point that will be explained later. The paragraph also addresses two common questions: why bother with variance when it's difficult to interpret, and why divide by n minus 1. The speaker then discusses the concept of describing the spread of a dataset, explaining the limitations of using the range and the rationale behind squaring deviations to get a numerical measure of spread that doesn't cancel out positive and negative deviations.
🔢 Understanding Sample Mean and Degrees of Freedom
This paragraph delves into the distinction between the population mean and the sample mean, explaining why variance is calculated using n minus 1 instead of n. The speaker clarifies that variance is an estimate of the average squared deviation from the population mean, and since we don't know the true population mean, we use the sample mean as an approximation. This leads to an underestimation of the true variance, which is corrected by dividing by n minus 1, thus inflating the estimate. The concept of degrees of freedom is introduced, with an example showing how the freedom to choose values for a new data set is restricted when a sample mean is known, as opposed to when only the population mean is known.
Mindmap
Keywords
💡Variance
💡Standard Deviation
💡Mean
💡Deviation
💡Data Set
💡Moments
💡Degrees of Freedom
💡Population Mean
💡Sample Mean
💡Squaring
💡Summation
Highlights
Introduction to variance and standard deviation concepts.
Using a dataset of weekly expenditure on petrol for 12 weeks to illustrate calculations.
Explanation of how to calculate the mean (average) of a dataset.
Description of the variance calculation process, including the squaring of individual deviations.
Clarification on why variance is calculated by squaring deviations rather than using absolute values.
Discussion on the importance of the standard deviation in making data more intelligible.
Addressing the common question of why we use the term 'variance' when it's difficult to assess.
Explanation of the difference between a population mean and a sample mean.
Rationale for dividing by 'n minus 1' in the variance calculation for sample data.
Illustration of how the sample mean affects the calculation of squared deviations.
Introduction to the concept of degrees of freedom in statistics.
Comparison between the calculation of population variance and sample variance.
Explanation of how degrees of freedom impact the calculation of variance.
Empirical demonstration of the derivation of the 'n minus 1' rule in an Excel spreadsheet.
Conclusion summarizing the informative nature of the discussion on variance, standard deviation, and degrees of freedom.
Transcripts
Browse More Related Video
Why do we divide by n-1 and not n? | shown with a simple example | variance and sd

Statistics: Standard deviation | Descriptive statistics | Probability and Statistics | Khan Academy
The Sample Variance: Why Divide by n-1?
Why are degrees of freedom (n-1) used in Variance and Standard Deviation
Variance and Standard Deviation: Sample and Population Practice Statistics Problems
Another simulation giving evidence that (n-1) gives us an unbiased estimate of variance
5.0 / 5 (0 votes)
Thanks for rating: