Transforming Algebraic Functions: Shifting, Stretching, and Reflecting
TLDRThe video explains how to transform the graph of basic functions like x squared by adding constants, which shifts the graph vertically, or by adding inside the parenthesis, which shifts the graph horizontally. It also shows how coefficients outside or inside the function transform the graph by stretching or shrinking it either vertically or horizontally. Finally, it explains how negative signs flip or reflect the graph. It emphasizes that these transformations work for graphing any function, making it easy to manipulate graphs once you know the basic form.
Takeaways
- 😀 We can transform the graph of a function by adding, subtracting, multiplying or dividing numbers.
- 😃 Adding or subtracting a number results in a vertical shift up or down.
- 😄 The sign of the number determines the direction of the vertical shift.
- 😁 Multiplying by a number results in a vertical stretch or shrink.
- 😆 Dividing by a number results in a horizontal stretch or shrink.
- 😕 Putting a number inside the function results in a horizontal shift left or right.
- 😟 The sign of the number determines the direction of the horizontal shift.
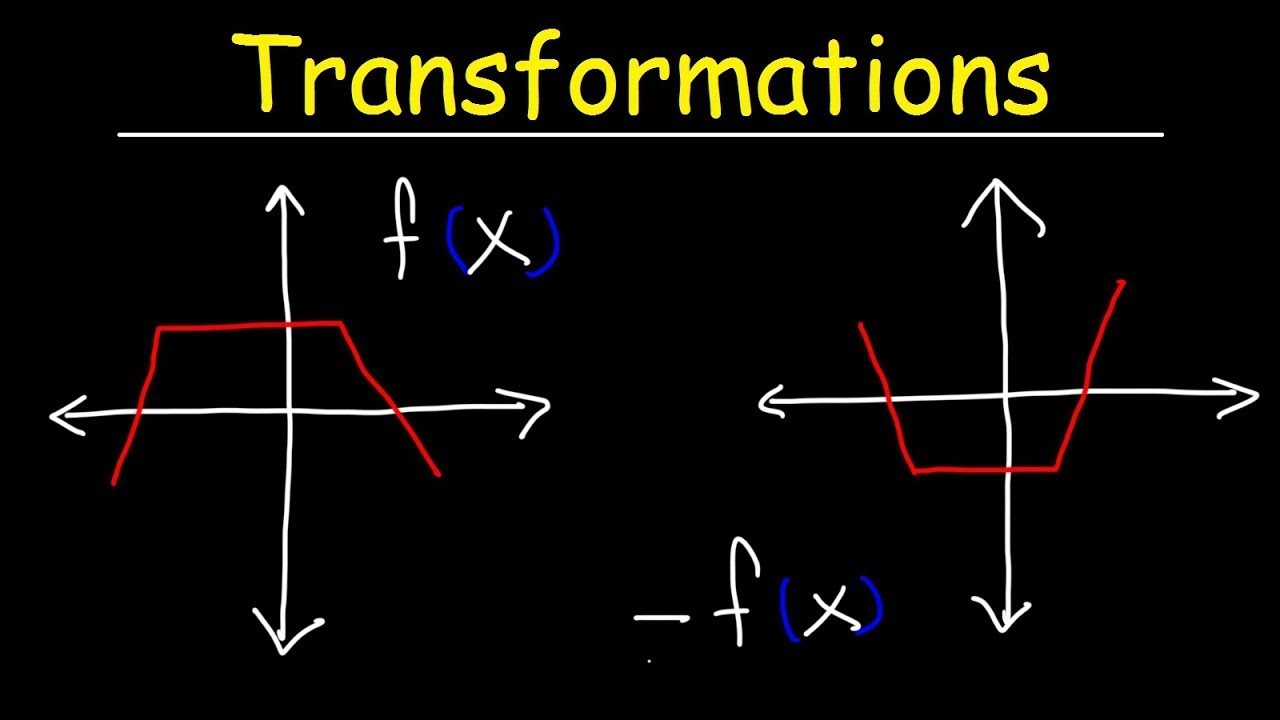
- 🤔 Putting a negative sign in front results in a reflection over the x or y axis.
- 😊 We can combine multiple transformations by applying them one at a time.
- 😉 Making a table of values can help see the effects of different transformations.
Q & A
What happens when you add or subtract a number from a function?
-Adding or subtracting a number produces a vertical shift in the function's graph. A positive number shifts the graph up, while a negative number shifts it down.
How do you graph a horizontally shifted function?
-To graph a horizontally shifted function like X + 2 squared, make a table of values and plot the points. The graph will be shifted left or right depending on whether the number inside the parenthesis is positive or negative.
What causes the graph to stretch vertically?
-Putting a number as a coefficient in front of the function, like 2X squared, causes a vertical stretch or shrink. If the coefficient is greater than 1, the graph stretches out vertically. If it's between 0 and 1, the graph shrinks vertically.
What happens when the coefficient is inside the parentheses?
-When the coefficient is inside, like 2(X squared), it causes a horizontal shrink or stretch. A coefficient greater than 1 shrinks the graph horizontally, while a number between 0 and 1 stretches it out horizontally.
How does a negative sign outside the parentheses affect the graph?
-Putting a negative sign before the function, like -X squared, reflects the graph upside down over the x-axis without changing the actual values.
What is the order of operations for transformations?
-Apply transformations in this order: 1) vertical shifts, 2) horizontal shifts, 3) vertical stretches/shrinks, 4) horizontal stretches/shrinks, 5) reflections.
What strategy can you use if the function doesn't decompose into basic transformations?
-If the function can't be broken down into basic transformations, you'll need to make a table of values by plugging in numbers and plotting points to graph it.
Why are transformations useful for graphing functions?
-Understanding how to transform the graphs of basic functions makes graphing much easier. Once you know how quadratic, cubic and square root functions look, you can apply shifts, stretches and reflections to graph variations.
Can you apply vertical shifts to any type of function?
-Yes, vertical shifts work for all kinds of functions - quadratic, cubic, square root, absolute value. If you shift the basic function graph up/down, the transformed graph will shift by the same amount.
Do horizontal and vertical stretches work differently?
-Yes. A vertical stretch with a coefficient greater than 1 makes the graph taller and narrower. A horizontal stretch with a coefficient greater than 1 makes the graph shorter and wider.
Outlines
📈 Graphing Transformed Functions
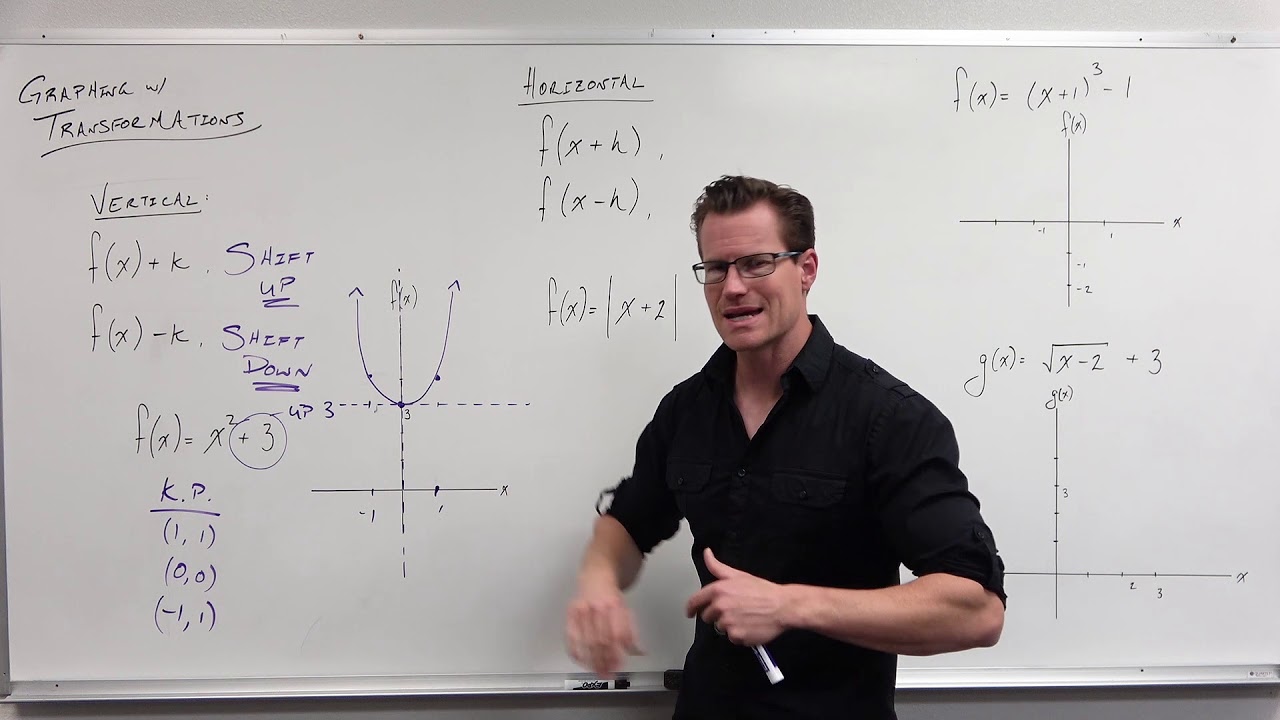
This paragraph explains how to graph transformed functions by recognizing vertical shifts, horizontal shifts, stretches, and reflections. It provides examples of graphing functions like x^2 + 2, (x + 2)^2, 2x^2, and -x^2 by making tables of values and plotting points. Key transformations covered include: adding/subtracting numbers for vertical shifts, adding/subtracting inside the parenthesis for horizontal shifts, multiplying by coefficients for stretches/compressions, and adding negative signs for reflections.
📉 Combining Multiple Transformations
This paragraph provides an example of graphing a function with multiple transformations, like -2(x - 3)^2 + 4. It explains applying the transformations sequentially, starting with the basic x^2 graph. The steps are: 1) vertical shift up 4 units, 2) horizontal shift right 3 units, 3) stretch vertically by factor of 2, 4) reflect over x-axis. It emphasizes that these shift/stretch/reflect rules apply to graphs of any type of function.
Mindmap
Keywords
💡graph
💡function
💡transformation
💡vertex
💡coefficient
💡axis
💡table
💡plot
💡shift
💡slope
Highlights
The use of algorithmic methods like deep learning for disease diagnosis can improve accuracy and efficiency.
Advancements in medical imaging analysis through AI have enabled earlier detection of diseases like cancer.
AI assistants can help doctors with administrative tasks, freeing up more time for patient care.
Shared decision-making between doctors and AI systems can combine human expertise and machine intelligence.
AI can analyze large volumes of healthcare data to uncover patterns and insights for improving treatments.
More data and research are still needed to ensure AI systems are fair, unbiased, and safe in healthcare.
AI-enabled robotics and prosthetics can assist with surgeries or help patients with disabilities.
Healthcare AI must be carefully designed to protect patient privacy and maintain confidentiality.
Regulations around AI in healthcare are evolving to ensure safety, accountability, and transparency.
AI has potential benefits in medication management, personalized treatment plans, and optimization of clinical trials.
Effective human-AI collaboration in healthcare requires new approaches to training both clinicians and AI systems.
More interdisciplinary research on healthcare AI involving medicine, computer science, ethics, law, and social sciences is needed.
Healthcare AI should augment human capabilities and care while avoiding over-reliance on automated systems.
Extensive testing and validation are critical before deploying healthcare AI to ensure safety and efficacy.
Clear communication, education, and change management will be key to successfully integrating AI in healthcare.
Transcripts
Browse More Related Video
Introduction to Graph Transformations (Precalculus - College Algebra 14)
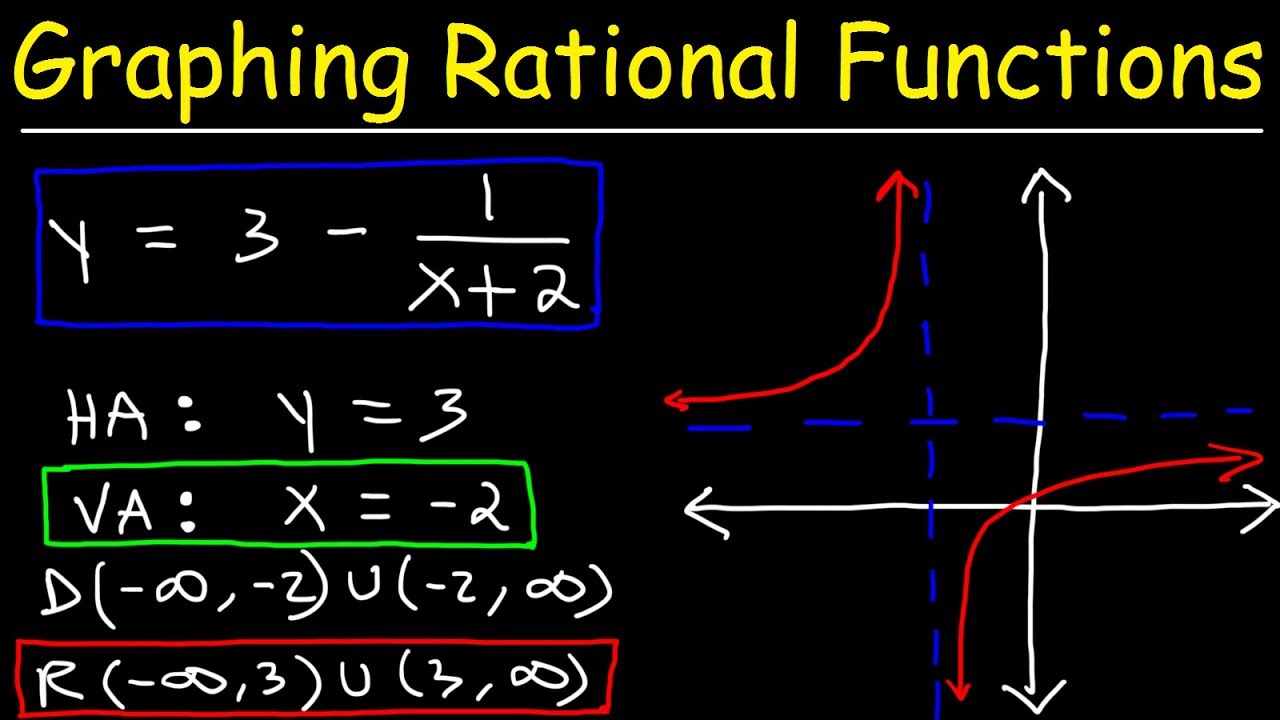
Graphing Rational Functions Using Transformations With Vertical and Horizontal Asymptotes
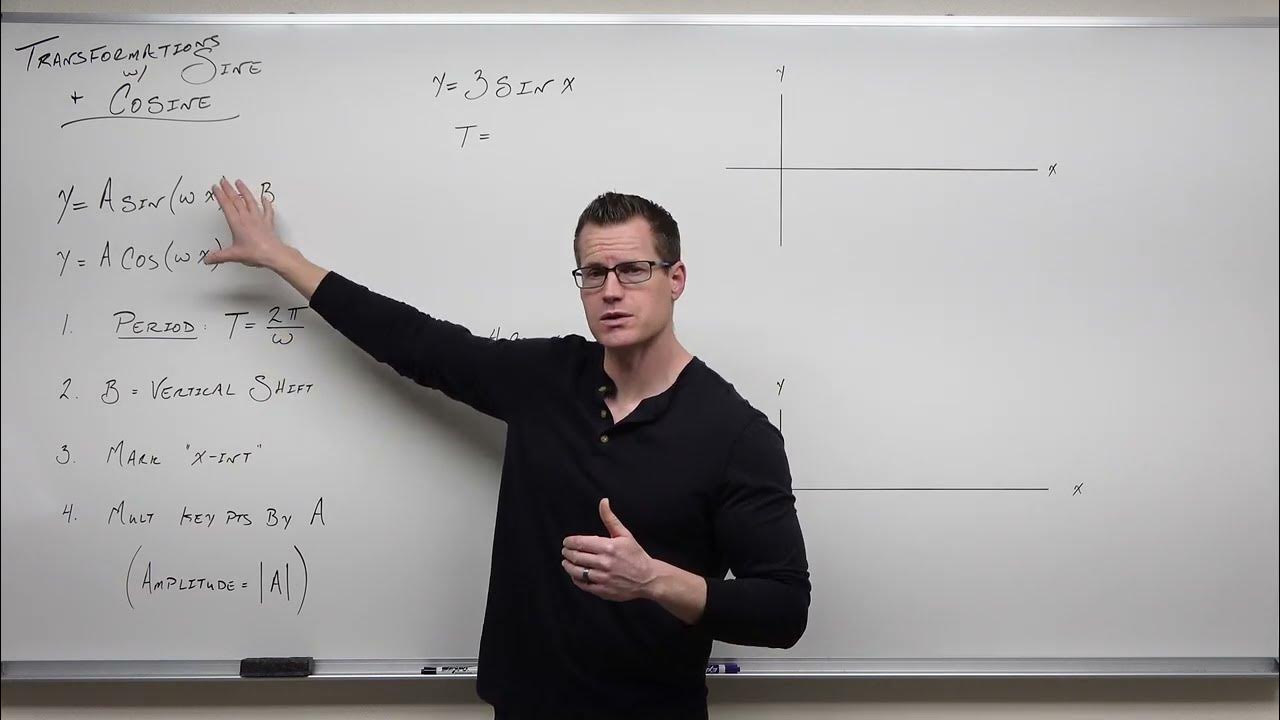
Graphing Transformations with Sine and Cosine (Precalculus - Trigonometry 12)
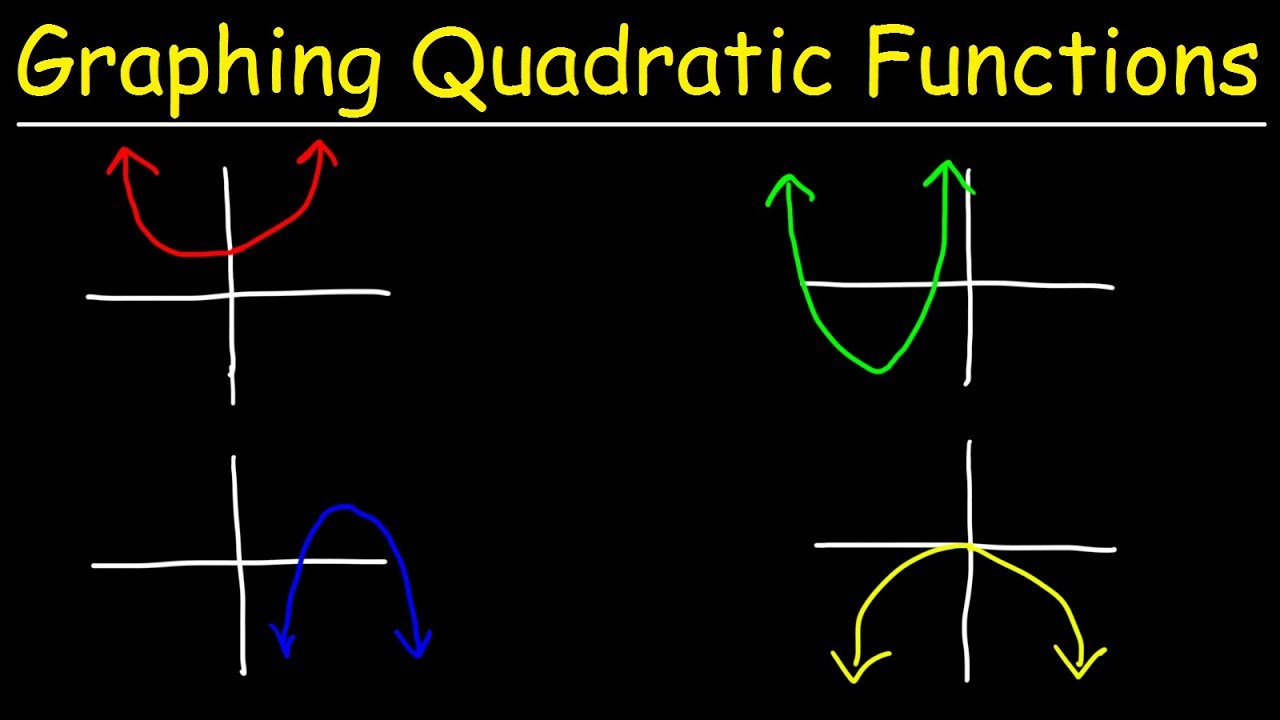
Graphing Quadratic Functions Using Transformations
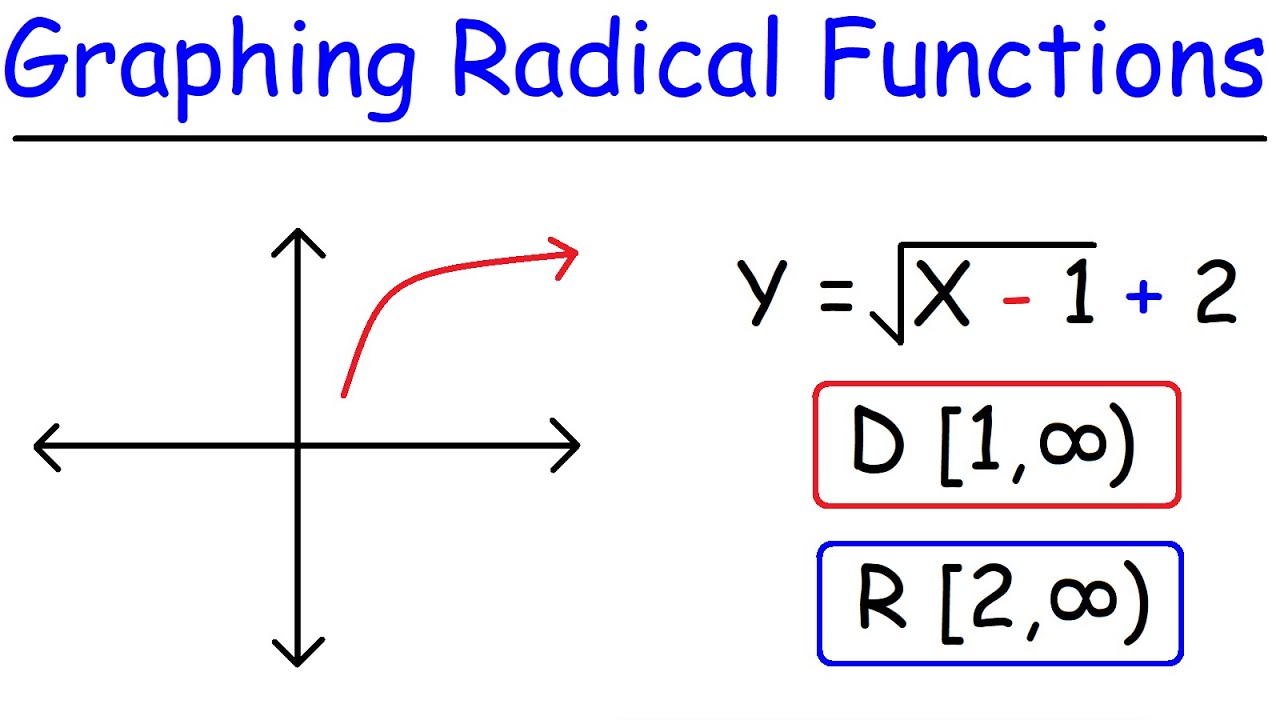
How To Graph Radical Functions & Determine The Domain and Range
Transformations of Functions | Precalculus
5.0 / 5 (0 votes)
Thanks for rating: