Statistics: Standard deviation | Descriptive statistics | Probability and Statistics | Khan Academy
TLDRThis video script offers a comprehensive review of statistical concepts, focusing on measures of central tendency like mean, median, and mode, and then delves into variance and standard deviation. It explains the formulas for calculating population and sample variance, highlighting the use of 'n-1' for an unbiased sample variance estimate. The script also clarifies the relationship between variance and standard deviation, emphasizing the practicality of standard deviation in measuring dispersion in the same units as the data. The presenter illustrates these concepts with a numerical example, calculating mean, variance, and standard deviation for a given set of numbers, and discusses the implications of these calculations in understanding data distribution.
Takeaways
- 📚 The script reviews statistical concepts such as mean, median, mode, variance, and standard deviation, focusing on their application to both populations and samples.
- 🧮 The mean is calculated as the sum of all data points divided by the number of points, and it's represented by the Greek letter mu for a population and x-bar for a sample.
- 📊 Variance measures the average of the squared differences from the mean, denoted by sigma squared (σ²) for a population and s squared for a sample.
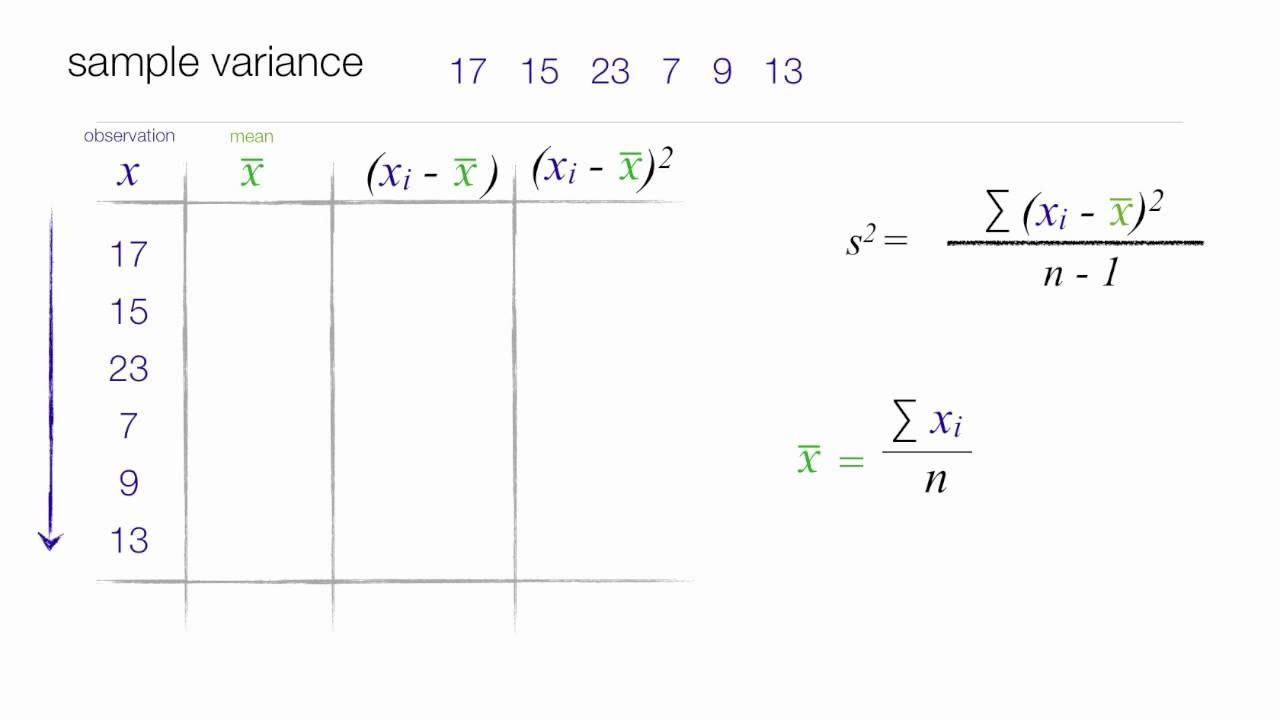
- 🔍 To estimate the population variance from a sample, an unbiased estimator is used, which divides the sum of squared differences by n-1 instead of n.
- 📐 The standard deviation is the square root of the variance, providing a measure of dispersion in the same units as the data, denoted by sigma (σ) for a population and s for a sample.
- 🌐 The script explains that the standard deviation of a sample is not an unbiased estimator of the population standard deviation, but it's a good estimate.
- 📘 The importance of standard deviation is highlighted in terms of its practical use, such as making the units more interpretable and its significance in a normal distribution.
- 🔢 A practical example is given to calculate the mean and variance of a set of numbers (1, 2, 3, 8, 7) treated as a population, resulting in a mean of 4.20 and a variance of 7.76.
- 🔄 The process of calculating variance and standard deviation is demonstrated with a step-by-step approach, emphasizing the formula application.
- 📉 If the numbers were a sample, the variance would be calculated by dividing by n-1, resulting in a sample variance of 9.70 and a sample standard deviation of approximately 3.13.
- 📚 The script concludes by emphasizing the importance of understanding these statistical measures and their calculations in real-world applications.
Q & A
What is the primary statistical concept discussed in the transcript?
-The primary statistical concept discussed is the mean or central tendency, along with variance and standard deviation.
How is the mean of a population calculated?
-The mean of a population is calculated by summing all the data points in the population and then dividing by the total number of data points (N). This is represented by the Greek letter mu (μ).
How is the mean of a sample different from the mean of a population?
-The mean of a sample is similar to the mean of a population but uses a slightly different notation (x̄). The calculation involves summing all the data points in the sample and dividing by the number of data points in the sample (n).
What is variance and how is it calculated for a population?
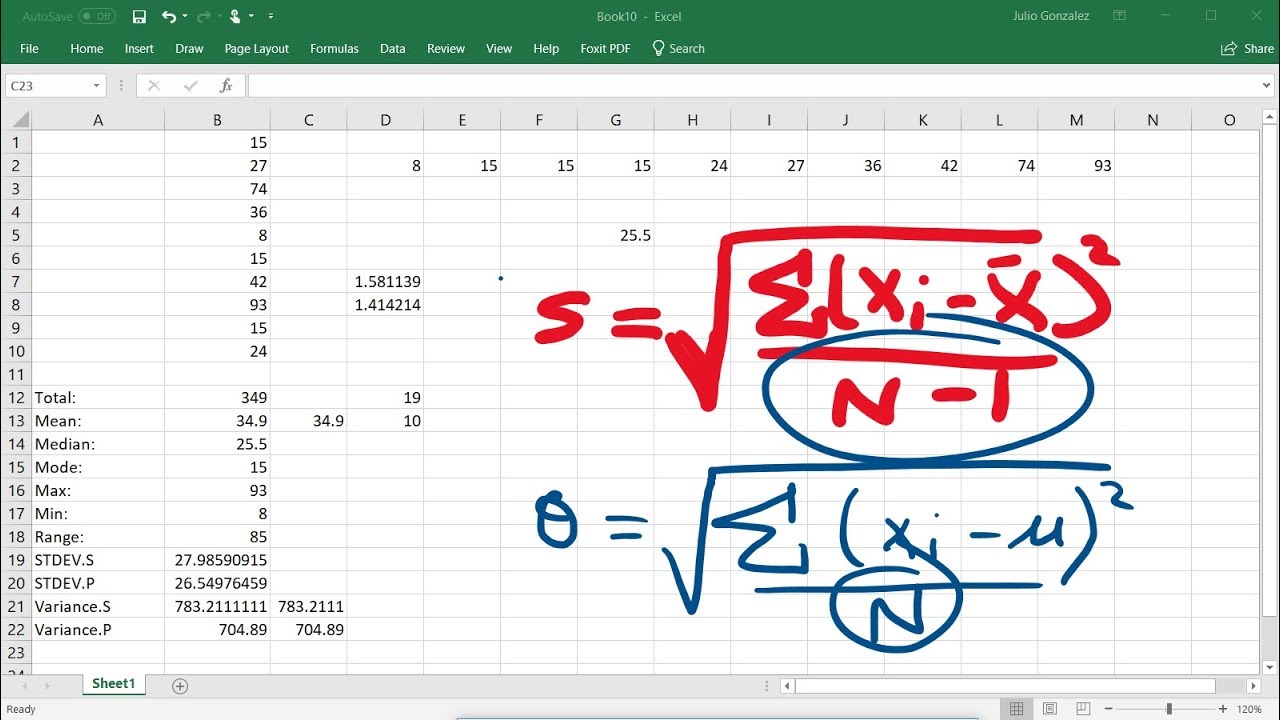
-Variance measures how far data points are from the mean. For a population, variance (σ²) is calculated by taking the sum of the squared differences between each data point and the mean, then dividing by the number of data points (N).
Why do we use n-1 instead of n when calculating sample variance?
-Using n-1 instead of n when calculating sample variance provides an unbiased estimate of the population variance. This adjustment compensates for the fact that a sample is only an estimate of the population.
What is the formula for calculating sample variance?
-The formula for sample variance (s²) is the sum of the squared differences between each data point and the sample mean, divided by (n-1).
What is the standard deviation and how is it related to variance?
-Standard deviation is the square root of variance. It provides a measure of dispersion in the same units as the original data, making it easier to interpret.
How do you calculate the standard deviation of a population?
-The standard deviation of a population (σ) is calculated by taking the square root of the population variance (σ²).
How do you calculate the standard deviation of a sample?
-The standard deviation of a sample (s) is calculated by taking the square root of the sample variance (s²).
Why might the units of variance be considered strange or less intuitive than those of standard deviation?
-The units of variance are the square of the units of the original data (e.g., meters squared), which can be less intuitive to interpret. Standard deviation, being the square root of variance, returns to the original units (e.g., meters), making it more intuitive to understand the dispersion.
How is the mean, variance, and standard deviation calculated using a given data set?
-Using the data set {1, 2, 3, 8, 7}, the mean is calculated by summing the data points and dividing by the number of points (4.20). The variance is calculated by finding the squared differences from the mean, summing them, and dividing by the number of data points (7.76 for population). The standard deviation is the square root of the variance (2.79 for population).
Outlines
📚 Review of Statistical Concepts
This paragraph introduces a review of statistical concepts, focusing on measures of central tendency like mean, median, and mode, with an emphasis on the mean. It explains the formula for calculating the mean of a population (μ) and a sample (x̄), highlighting the difference in notation and calculation. The paragraph also introduces the concept of variance (σ² for population, s² for sample), explaining how it measures the average squared deviation from the mean, and the importance of using n-1 for an unbiased sample variance estimate. Variance is a key concept that will be further explored in the video.
📉 Understanding Variance and Standard Deviation
The second paragraph delves deeper into the concept of variance and its calculation, both for a population and a sample. It clarifies the difference between the two, particularly the division by N for population variance and by N-1 for an unbiased sample variance. The paragraph also introduces standard deviation, which is the square root of variance, and explains its significance in providing a measure of dispersion in the same units as the data. The standard deviation is crucial for understanding the spread of data and is a fundamental concept in statistics, with applications in various fields.
🔢 Practical Calculation of Mean, Variance, and Standard Deviation
The final paragraph provides a practical example to illustrate the calculation of mean, variance, and standard deviation. Using the data set 1, 2, 3, 8, and 7, the speaker calculates the mean of the population and then demonstrates how to compute the variance by summing the squared differences from the mean and dividing by the number of data points. The standard deviation is then found by taking the square root of the variance. The paragraph also briefly touches on the difference in calculation if the data were a sample from a larger population, emphasizing the division by N-1 for sample variance. This practical demonstration aims to solidify the understanding of these statistical measures.
Mindmap
Keywords
💡Mean
💡Median
💡Mode
💡Variance
💡Sample Variance
💡Standard Deviation
💡Sample Standard Deviation
💡Population
💡Sample
💡Unbiased Estimator
Highlights
Introduction to reviewing statistical concepts and their integration.
Explanation of the mean as a measure of central tendency for both population and sample data sets.
Introduction of median and mode as alternative measures of central tendency.
Discussion on the prevalence of the mean in variance and standard deviation calculations.
Formula for calculating the mean of a population using the Greek letter mu.
Description of the process to calculate the mean of a sample, denoted as x̄.
Introduction to the concept of variance as a measure of data spread.
Explanation of population variance calculation using sigma squared notation.
Differentiation between population and sample variance, emphasizing unbiased estimation for samples.
Formula for sample variance calculation, including the division by n-1 for unbiased estimation.
Introduction to standard deviation as the square root of variance.
Explanation of standard deviation for a population, denoted by sigma.
Discussion on the difference between sample standard deviation and an unbiased estimator.
Practical example calculation of mean, variance, and standard deviation using the numbers 1, 2, 3, 8, and 7.
Demonstration of calculating population variance and standard deviation using the provided data set.
Illustration of how variance and standard deviation change when considering data as a sample instead of a population.
Final calculation of sample variance and standard deviation, emphasizing the impact of dividing by n-1.
Conclusion summarizing the process and encouraging further exploration in the next video.
Transcripts
Browse More Related Video
Calculating The Standard Deviation, Mean, Median, Mode, Range, & Variance Using Excel
Measures of Dispersion (Ungrouped Data) | Basic Statistics
Variance and Standard Deviation: Sample and Population Practice Statistics Problems
Range, variance and standard deviation as measures of dispersion | Khan Academy
Variance and Standard Deviation: Why divide by n-1?
How to calculate Standard Deviation and Variance
5.0 / 5 (0 votes)
Thanks for rating: