The Sample Variance: Why Divide by n-1?
TLDRThe video script explains the rationale behind using n-1 instead of n in the sample variance formula. It discusses how the sample mean is used as an estimate for the population mean, which can lead to an underestimation of the population variance. To correct this, dividing by n-1 is introduced as it provides an unbiased estimator of the population variance, a concept also linked to degrees of freedom. The script uses examples to illustrate how degrees of freedom change when estimating the population mean, affecting the calculation of sample variance.
Takeaways
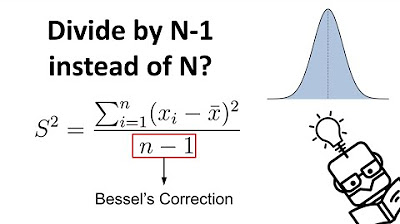
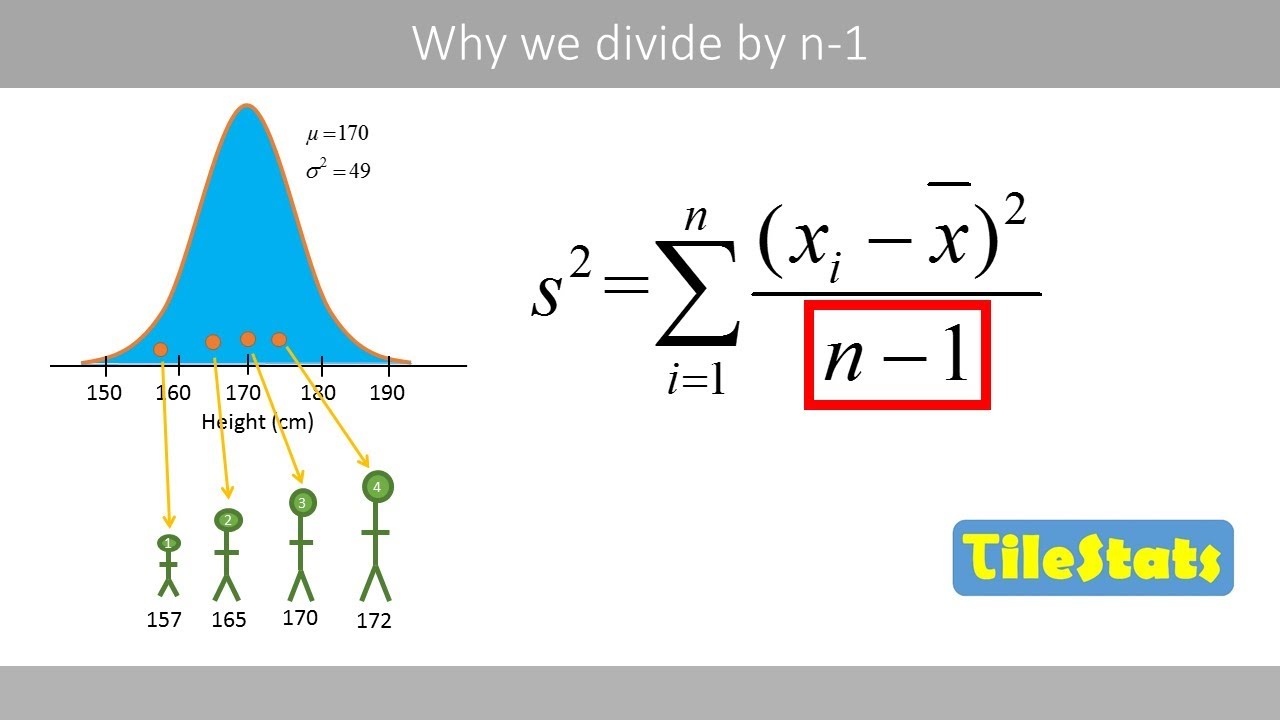
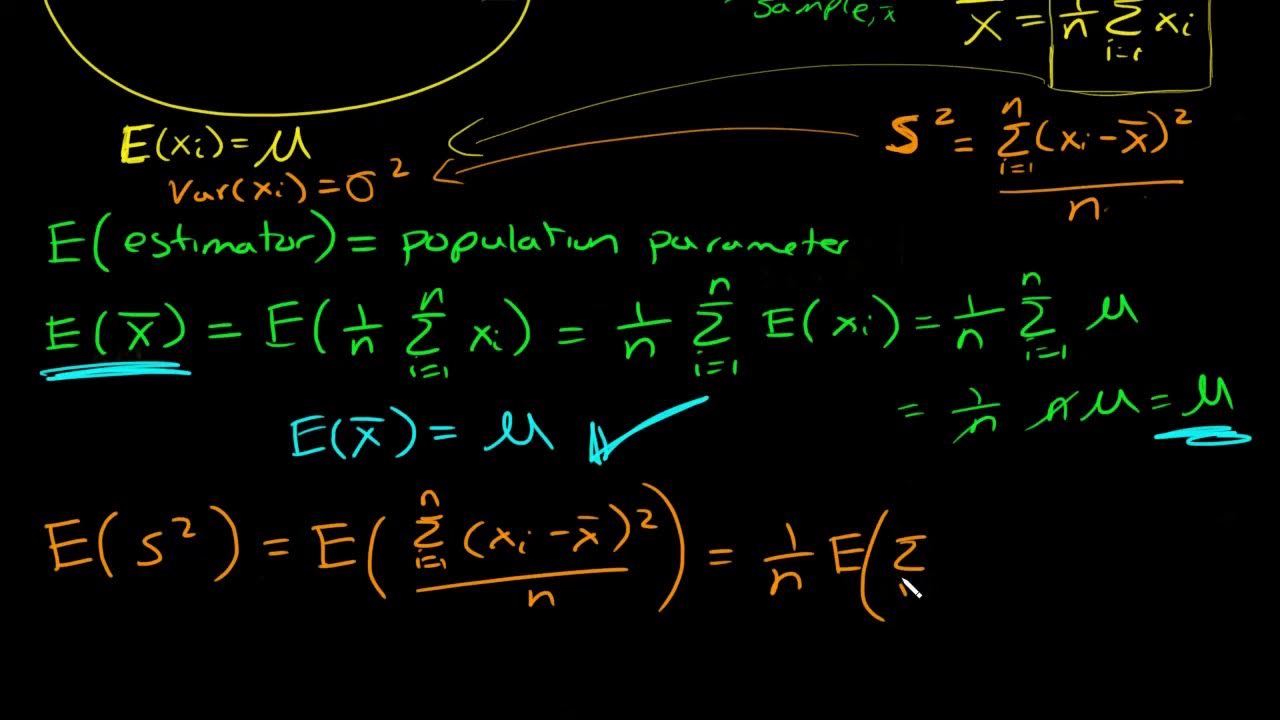
- 📊 The sample variance formula divides by n minus 1, not n, to correct for the underestimation of the population variance when the true mean is unknown.
- 🔢 N represents the sample size and is used to estimate population parameters like the mean (mu) and variance (sigma squared).
- 🌟 The true mean (mu) is often unknown, so the sample mean (x-bar) is used as the best estimate in the calculation of sample variance.
- 📉 Using the sample mean in place of the true mean results in a sum that is smaller than it would be if the true mean were used, thus leading to an underestimation of the population variance.
- 🔄 The division by n minus 1 compensates for this underestimation, providing an unbiased estimator of the population variance on average.
- 🚫 The script does not delve into why n minus 2, n minus 3, or n minus 0.5 would not be appropriate divisors for unbiased estimation.
- 📐 The concept of degrees of freedom is introduced as the number of independent values in a calculation that can vary freely.
- 🌰 Two examples are provided: one where the population mean is known and one where it is estimated from the sample, showing the impact on degrees of freedom.
- 🔢 In the scenario with an unknown population mean, once the sample mean and two observations are known, the third observation and its deviation are fixed, leaving only two degrees of freedom.
- 📊 The script emphasizes that dividing the sum of squared deviations by the degrees of freedom (n minus 1) rather than the sample size provides a better estimator for the population variance.
Q & A
Why do we divide by n minus 1 instead of n in the sample variance formula?
-Dividing by n minus 1 in the sample variance formula compensates for the underestimation of the population variance that occurs when using the sample mean as an estimate for the population mean. This adjustment results in an unbiased estimator of the population variance, known as Bessel's correction.
What are the parameters of a population that we often want to estimate with a sample?
-The two parameters of a population that are commonly estimated with a sample are the population mean (mu) and the population variance (Sigma squared).
What is the ideal estimator for the population variance if the population mean was known?
-The ideal estimator for the population variance, if the population mean (mu) was known, would be the sum of the squared differences between each observation and the true population mean, divided by the sample size (n).
Why can't we use the true mean in the sample variance formula?
-We cannot use the true mean in the sample variance formula because it is usually unknown. Instead, we use the sample mean as the best estimate of the population mean.
What is the effect of substituting the true mean with the sample mean in the variance estimation?
-Substituting the true mean with the sample mean in the variance estimation tends to make the sum of squared differences smaller, leading to an underestimation of the population variance.
How does the concept of degrees of freedom relate to the sample variance?
-The degrees of freedom in the context of the sample variance refers to the number of independent values in the calculation that can vary freely. When estimating the population mean with the sample mean, one degree of freedom is lost, leading to the division by n minus 1 in the sample variance formula.
What happens to the degrees of freedom when we estimate the population mean with the sample mean?
-When we estimate the population mean with the sample mean, we lose one degree of freedom. This is because the sum of the deviations from the sample mean must equal zero, and thus, knowing the sample mean and any two observations determines the third observation.
Why is the sample variance a better estimator when we divide by the degrees of freedom rather than the sample size?
-Dividing by the degrees of freedom, which is n minus 1, provides a better estimator of the population variance because it accounts for the loss of one degree of freedom when estimating the population mean. This adjustment results in an unbiased estimator of the population variance.
What is an unbiased estimator?
-An unbiased estimator is one that, on average, equals the true value of the parameter it is estimating. In the context of the sample variance, dividing by n minus 1 results in an unbiased estimator of the population variance.
How does the sample mean affect the sum of squared deviations from the true mean?
-The sample mean, being an estimate of the true mean, tends to fall near the center of the observations. This causes the sum of squared deviations from the sample mean to be smaller than from the true mean, leading to an underestimation of the population variance.
Why don't we divide by n minus 2, n minus 3, or n minus 0.5 in the sample variance formula?
-Dividing by n minus 1 specifically results in an unbiased estimator of the population variance. Dividing by other values, such as n minus 2, n minus 3, or n minus 0.5, would not compensate correctly for the bias introduced by estimating the population mean with the sample mean and would not yield an unbiased estimator.
What is the significance of the sum of squared deviations from the sample mean always equaling zero?
-The sum of squared deviations from the sample mean always equaling zero signifies that the degrees of freedom are fully accounted for in the sample variance calculation. It reflects the fact that once the sample mean and any two observations are known, the third observation is determined, and thus, it cannot be freely varied.
Outlines
📊 Introduction to Sample Variance and Degrees of Freedom
This paragraph introduces the concept of sample variance in the context of an introductory statistics course. It explains why we divide by n minus 1 instead of n when calculating sample variance. The discussion begins with the premise that we often estimate population parameters like mean (mu) and variance (Sigma squared) using sample statistics. The paragraph outlines the process of estimating the population variance using the sum of squared deviations from the sample mean (x-bar) and highlights the issue of underestimation when the true mean (mu) is unknown. It then explains how using n minus 1 as the divisor compensates for this underestimation, providing an unbiased estimator of the population variance. The concept of degrees of freedom is introduced as a way to understand the number of independent values that can vary in a calculation, with an example illustrating how estimating the population mean reduces the degrees of freedom.
🔢 Degrees of Freedom and Sample Variance Calculation
The second paragraph delves deeper into the concept of degrees of freedom and how it relates to the calculation of sample variance. It contrasts two scenarios: one where the population mean (mu) is known and another where it is estimated from the sample data. The paragraph explains that when mu is known, each observation can independently vary, resulting in three degrees of freedom. However, when mu is estimated from the sample mean (x-bar), the values of the observations are no longer completely independent, as they must satisfy the condition that the sample mean equals the calculated x-bar. This reduces the degrees of freedom to two, and the sum of squared deviations from the sample mean must always sum to zero. The paragraph emphasizes that dividing by the degrees of freedom (n minus 1) when estimating the population variance leads to a more accurate estimator, as demonstrated in previous mathematical discussions.
Mindmap
Keywords
💡sample variance
💡population mean (mu)
💡sample mean (x-bar)
💡population variance (Sigma squared)
💡degrees of freedom
💡biased estimator
💡unbiased estimator
💡sum of squared deviations
💡independent observations
💡estimation
💡mathematical proof
Highlights
The discussion is pitched at the level of an introductory statistics course for non-majors.
The concept of estimating population parameters with sample statistics is introduced.
The true mean (mu) is usually unknown, which complicates the estimation of population variance (Sigma squared).
The sample mean (x-bar) is used as an estimate for the population mean (mu).
Subtracting the sample mean from each observation tends to underestimate the true population variance.
Dividing by n minus 1 compensates for the underestimation and provides an unbiased estimator of the population variance.
The rationale behind using n minus 1 instead of n is explained through the concept of degrees of freedom.
Degrees of freedom refer to the number of values in a calculation that are free to vary.
In the context of sample variance, degrees of freedom equal the number of independent observations minus one.
A scenario with known population mean illustrates the concept of degrees of freedom.
When the population mean is known, each observation can vary independently.
In contrast, when estimating the population mean, the degrees of freedom are reduced by one.
The sum of squared deviations from the sample mean always equals zero when the sample mean is used.
The third observation's value and deviation are determined by the first two observations and the sample mean.
Dividing the sum of squared deviations by the degrees of freedom (n minus 1) results in a better estimator of population variance.
The mathematical proof of unbiased estimation by dividing by n minus 1 is mentioned but not elaborated in this video.
The video aims to provide motivation for the use of n minus 1 in the sample variance formula.
Transcripts
Browse More Related Video
Why We Divide by N-1 in the Sample Variance (Standard Deviation) Formula | The Bessel's Correction
Why do we divide by n-1 and not n? | shown with a simple example | variance and sd
Another simulation giving evidence that (n-1) gives us an unbiased estimate of variance
Simulation showing bias in sample variance | Probability and Statistics | Khan Academy
What is an unbiased estimator? Proof sample mean is unbiased and why we divide by n-1 for sample var

Dividing By n-1 Explained
5.0 / 5 (0 votes)
Thanks for rating: