Why are degrees of freedom (n-1) used in Variance and Standard Deviation
TLDRThis video delves into the concept of degrees of freedom in relation to variance and standard deviation. It visually explains degrees of freedom using a bell curve and a sample subset, illustrating the impact of the 'N minus one' adjustment on variance calculation. The presenter compares variance calculations with and without this adjustment through numerical examples and a table, demonstrating how the difference diminishes as sample size increases. The video also addresses why the 'N minus one' adjustment is not applied to population variance, contrasting it with sample variance. The content is designed to clarify statistical concepts and encourage further exploration of the topic.
Takeaways
- 📚 The video discusses the concept of degrees of freedom in relation to variance and standard deviation.
- 📊 It graphically illustrates the idea of degrees of freedom using a bell curve to represent a population and a sample subset.
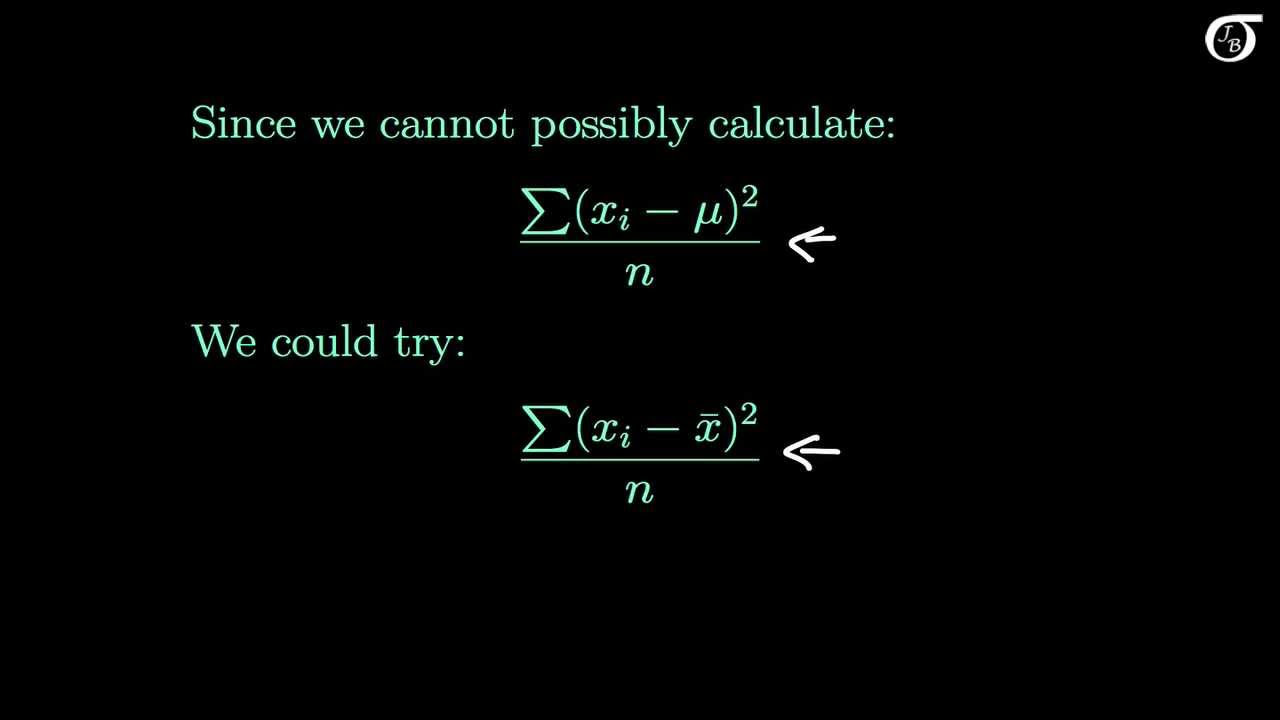
- 🔍 The video explains the difference between dividing by 'n' for population variance and 'n-1' for sample variance.
- 📉 As sample size increases, the error rate between the sample mean and population mean decreases, affecting the variance calculation.
- 🔢 A numerical example is given where the numerator is 240, and the impact of dividing by 'n' and 'n-1' is compared.
- 📈 A table is used to track the results of variance calculations for different sample sizes.
- 📊 The video shows that the difference between 'n' and 'n-1' calculations is significant for small sample sizes but diminishes as sample size increases.
- 📉 A graph is presented to visually demonstrate how the impact of the 'n-1' adjustment decreases with larger sample sizes.
- 🤔 The video addresses why the 'n-1' adjustment is not made for population variance but is for sample variance.
- 🌐 It explains that when the sample size equals the population size, no adjustment is necessary because the sample mean equals the population mean.
- 📚 The presenter mentions that the concept of degrees of freedom is used in various statistical calculations and promises to delve into the theory behind it in a future video.
Q & A
What is the main topic discussed in the video?
-The video discusses the concept of degrees of freedom in relation to variance and standard deviation, and explains why we adjust the formula for sample variance with 'N-1' instead of 'N'.
What is the purpose of the 'N-1' adjustment in calculating sample variance?
-The 'N-1' adjustment, known as Bessel's correction, is used to provide an unbiased estimate of the population variance from a sample. It accounts for the fact that the sample mean is not the same as the population mean, and as the sample size increases, the impact of this adjustment decreases.
How does the sample size affect the difference between using 'N' and 'N-1' in variance calculations?
-The difference between using 'N' and 'N-1' is more pronounced with smaller sample sizes. As the sample size increases, the difference becomes less significant, and it approaches zero as the sample size approaches the population size.
What is the graphical representation used in the video to explain degrees of freedom?
-The video uses a bell curve to represent a population distribution and a subset of this curve to represent a sample. The graphical representation helps to illustrate the concept of degrees of freedom and the impact of the 'N-1' adjustment on the spread of the sample distribution.
Why is the 'N-1' adjustment not necessary when calculating population variance?
-The 'N-1' adjustment is not necessary for population variance because the entire population is being considered, and there is no need to estimate the variance based on a subset of the data. The population mean and variance are known, so there is no error to adjust for.
What is the difference between population variance and sample variance?
-Population variance is calculated using the entire population data and does not require an adjustment for degrees of freedom. Sample variance, on the other hand, is an estimate based on a subset of the population and uses the 'N-1' adjustment to correct for bias in the estimation.
How does the video demonstrate the impact of the 'N-1' adjustment on variance calculations?
-The video provides a numerical example using a fixed numerator of 240 and divides it by both 'N' and 'N-1' for different sample sizes. It then compares the results to show how the 'N-1' adjustment increases the calculated variance and how the difference between the two calculations decreases as sample size increases.
What is the significance of the mean in the context of the video?
-The mean is significant as it represents the central value around which the data points are distributed in a bell curve. The difference between the sample mean and the population mean is what necessitates the 'N-1' adjustment in sample variance calculations.
How does the video illustrate the concept of error in sample mean compared to population mean?
-The video uses the bell curve to show that as the sample size increases, the error (the difference between the sample mean and the population mean) decreases. This is important because it highlights the need for the 'N-1' adjustment to account for this error in variance calculations.
What is the practical implication of the 'N-1' adjustment in statistical analysis?
-The 'N-1' adjustment ensures that the sample variance is a better estimate of the population variance, especially when the sample size is small. This is crucial for making accurate inferences about the population from sample data.
Why is the video's explanation of degrees of freedom important for understanding statistical calculations?
-Understanding degrees of freedom is important because it helps to explain why certain statistical formulas, like the one for sample variance, require adjustments. It provides insight into the underlying assumptions and methodology of statistical analysis.
Outlines
📊 Degrees of Freedom and Variance Adjustment
This paragraph introduces the concept of degrees of freedom in relation to variance and standard deviation. The speaker plans to visually illustrate degrees of freedom and provide a numerical example to demonstrate the impact of using 'N minus one' when calculating sample variance versus 'N' for population variance. The explanation begins with a hypothetical bell curve representing a population mean (mu) and a sample mean (x-bar), highlighting the error rate between them. As sample size increases, the error rate should decrease. The variance calculation is then discussed, with an example using a numerator of 240 and dividing by both 'n' and 'n minus one' to show how the adjustment affects the spread of the bell curve. A table is proposed to track the results of these calculations, starting with a small sample size of four (n=4) and comparing the variances obtained by dividing 240 by 'n' and 'n minus one', resulting in differences that highlight the significance of the 'n minus one' adjustment, especially with small sample sizes.
🔍 Impact of Sample Size on Variance Calculation
The second paragraph delves deeper into the effect of sample size on the variance calculation and the necessity of the 'n minus one' adjustment. The speaker increases the sample size step by step, from four to twenty, and notes how the difference between variances calculated with and without the 'n minus one' adjustment decreases as the sample size grows. This is visually represented through a graph plotting the difference in variances against sample sizes, showing a significant difference at small sample sizes that diminishes as the sample size increases. The speaker also explains why the 'n minus one' adjustment is not applied to population variance, using the bell curve analogy to illustrate that when the sample size equals the population size, the sample mean equals the population mean, eliminating the need for adjustment. The paragraph concludes with an invitation for viewers to engage on social media platforms and a reminder to like and subscribe for more content.
Mindmap
Keywords
💡Degrees of Freedom
💡Variance
💡Standard Deviation
💡Sample
💡Population
💡Mean
💡Bell Curve
💡Error Rate
💡Sample Size
💡Adjustment
Highlights
The video discusses understanding degrees of freedom for variance and standard deviation.
Graphical representation of degrees of freedom is provided.
A numerical example is shown to illustrate the concept.
The impact of the N minus one adjustment on variance is explored.
Difference between population variance (divided by N) and sample variance (divided by N-1) is explained.
A bell curve is used to represent a population with a mean (mu).
A sample is a subset of the population with its own mean (x-bar).
Error rate decreases as sample size increases.
Variance calculation without adjustment (dividing by N) is shown.
Variance calculation with adjustment (dividing by N-1) is demonstrated.
A table is created to compare variance calculations.
Sample size of four is used to calculate variance with and without N-1 adjustment.
Increasing sample size to six and its effect on variance calculations is shown.
The difference between N and N-1 calculations decreases as sample size grows.
A graph illustrates the diminishing impact of N-1 adjustment with larger sample sizes.
The reason for not adjusting population variance like sample variance is explained.
The concept of error and adjustment in relation to sample size is clarified.
Degrees of freedom are shown to be relevant in various statistical calculations.
A future video on the theory behind degrees of freedom is announced.
Transcripts
Browse More Related Video
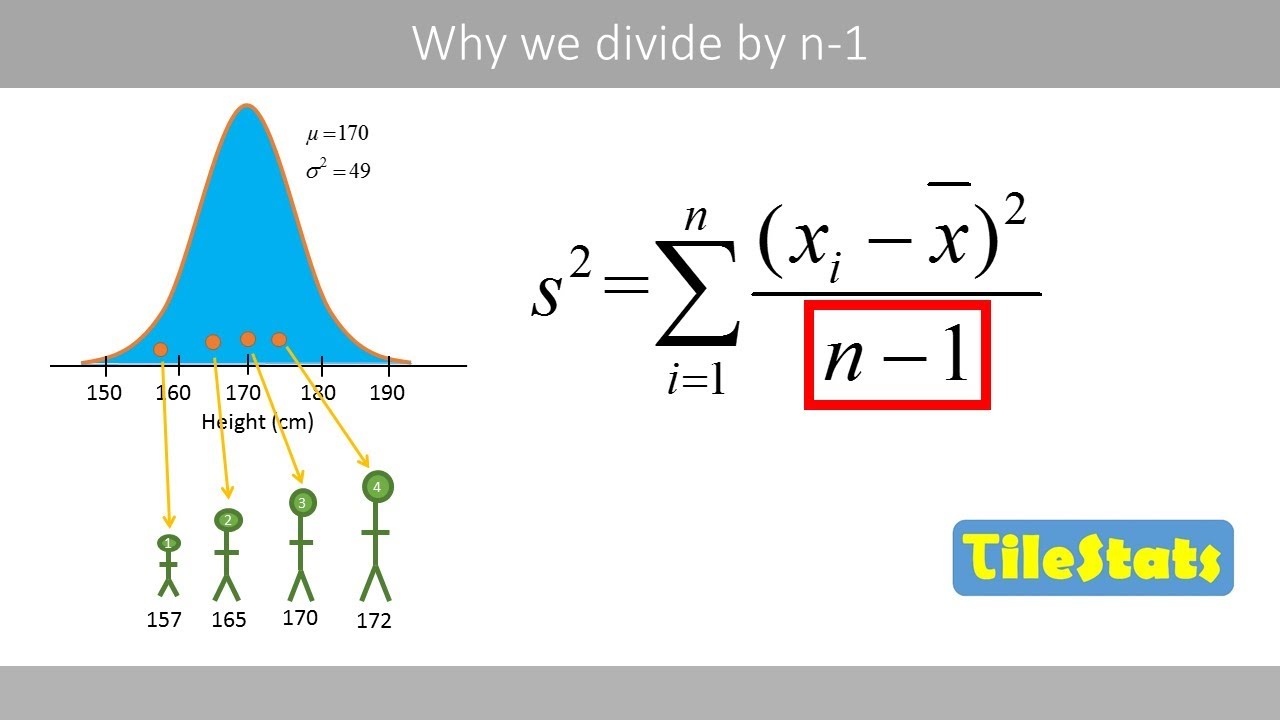
Variance and Standard Deviation: Why divide by n-1?
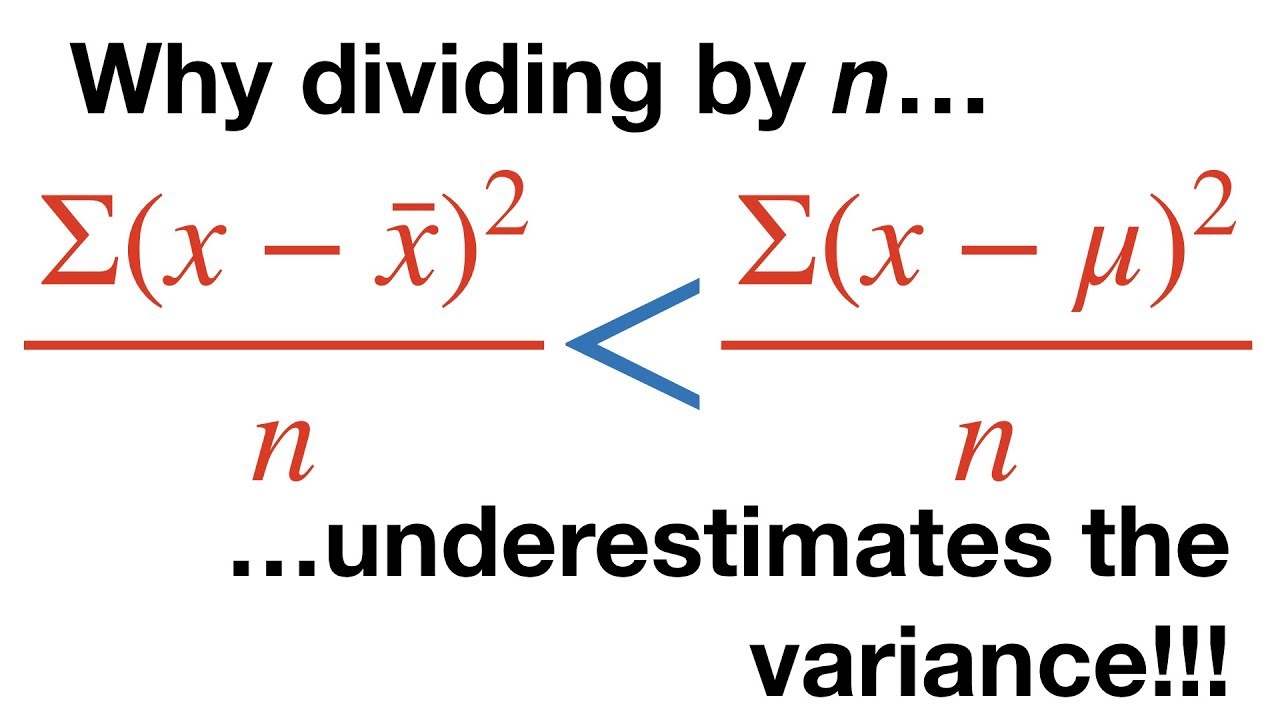
Why Dividing By N Underestimates the Variance
Why do we divide by n-1 and not n? | shown with a simple example | variance and sd
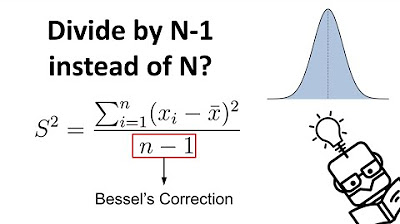
Why We Divide by N-1 in the Sample Variance (Standard Deviation) Formula | The Bessel's Correction

Dividing By n-1 Explained
The Sample Variance: Why Divide by n-1?
5.0 / 5 (0 votes)
Thanks for rating: