Graphing Conic Sections Part 4: Hyperbolas
TLDRThe video explains how to graph hyperbolas, the last conic section. It covers the definition of a hyperbola, with two foci where the difference between distances to each focus is constant. It explains the equation, similar to an ellipse but with a minus sign. It shows how to solve sample equations to find the vertices and foci. It discusses asymptotes, lines the hyperbola branches approach but don't touch, to aid graphing. It explains transforming hyperbolas by shifting the center. Overall, it provides a thorough overview of graphing and understanding hyperbolas.
Takeaways
- 😀 A hyperbola is defined by the difference between the distances to two foci being constant for every point on the curve.
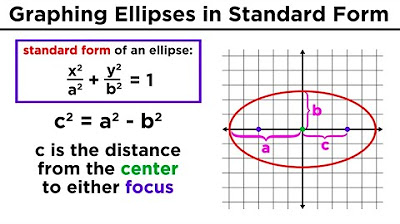
- 👍 The equation for a hyperbola is similar to an ellipse except with a minus sign instead of a plus between the x2 and y2 terms.
- 📏 The vertices of a hyperbola lie on the transverse axis connecting them, while the foci lie outside the branches.
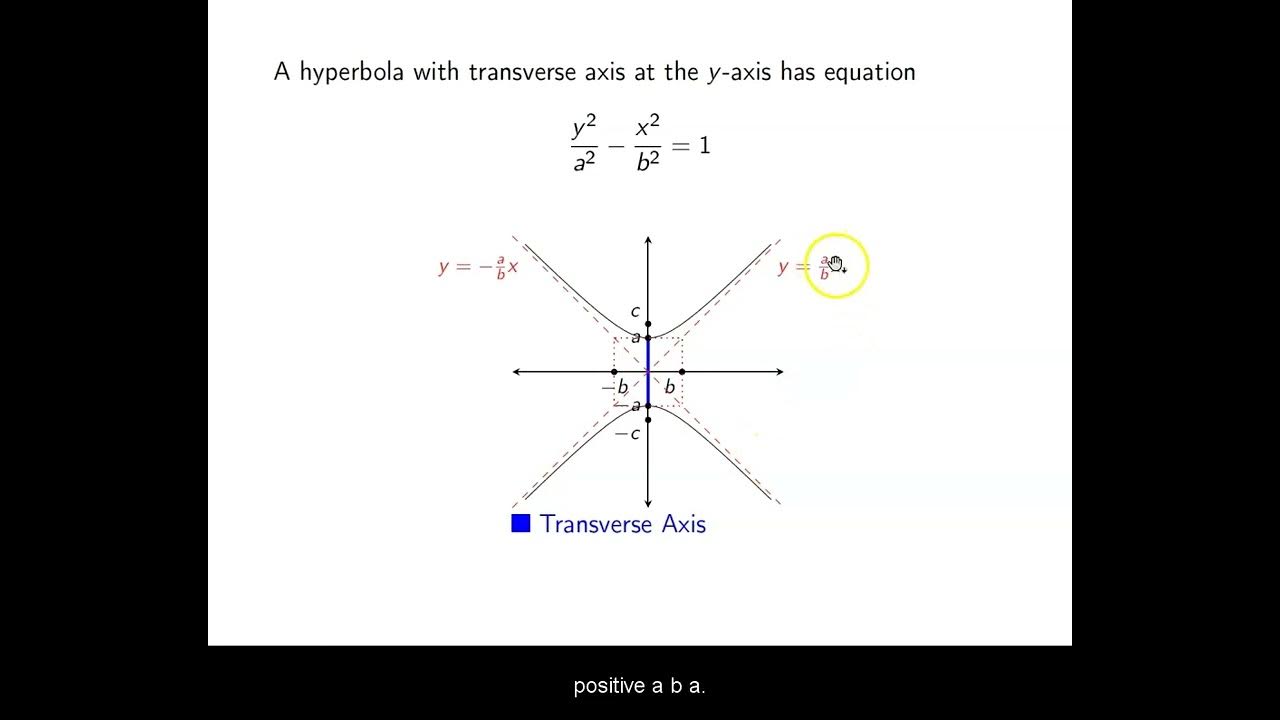
- 📐 If x2 comes before y2, the hyperbola opens horizontally around the x-axis. If y2 comes first, it opens vertically.
- 🔢 The constants A, B, and C have similar meanings to ellipses - A is half the distance between vertices, C is the distance to a focus.
- 🖊 You can sketch asymptotes to help draw hyperbola branches accurately.
- ⚙️ The equation can be manipulated into standard form by dividing through to eliminate any coefficient not equal to 1 before x2 and y2.
- 🔧 Hyperbolas can be translated by replacing x and y with x-h and y-k to shift the center to (h,k).
- 📈 The branches of a hyperbola get closer to the asymptotes but never actually touch.
- 👍🏻 Checking comprehension of conic sections like hyperbolas is important after learning about how to graph them.
Q & A
What is the definition of a hyperbola?
-A hyperbola is defined as a set of points where the difference between the distances to two fixed points, called foci, is constant.
How does the equation of a hyperbola differ from that of an ellipse?
-The equation of a hyperbola uses a minus sign between the two terms instead of a plus sign like the ellipse equation. This reflects the constant difference rather than sum of distances to foci.
What do the A, B, and C terms represent in the standard hyperbola equation?
-A represents the distance from the center to one of the vertices. B no longer has a clear graphical meaning. C represents the distance from the center to one of the foci.
How can you determine which axis the hyperbola will open around?
-If the X term comes first in the equation, the hyperbola will open around the X axis. If the Y term comes first, it will open around the Y axis.
How can asymptotes help in graphing a hyperbola?
-Asymptotes show the path along which the hyperbola branches approach infinity. Sketching them with dotted lines can guide the drawing of the hyperbola branches.
What is the significance of the transverse axis of a hyperbola?
-The transverse axis connects the two vertices of the hyperbola. It is perpendicular to the axis of symmetry around which the hyperbola opens.
How can you transform the graph of a hyperbola?
-Subtracting values H and K from the X and Y terms shifts the center to the point (H,K). This transforms the hyperbola to be centered around that new point.
What are some similarities and differences between ellipses and hyperbolas?
-Both ellipses and hyperbolas have foci and vertices, but in hyperbolas the difference rather than sum of distances is constant. Their equations have a similar form but use minus vs plus signs.
Where are the foci located relative to the hyperbola branches?
-The two foci are located on the outside of the two branches, one focus external to each branch.
What happens as you approach the asymptotes of a hyperbolic branch?
-As you move along a hyperbola branch towards its asymptote, the branch curves closer and closer to the asymptote but never actually touches or intersects it.
Outlines
📈 Graphing Hyperbolas
This paragraph provides an introduction to hyperbolas. It explains that a hyperbola is formed by a cone with the base of one side extending through to the base of the other side. It has two separate branches and the distances from any point on the hyperbola to two fixed foci have a constant difference. It identifies key parts of a hyperbola - the two foci, vertices, center, transverse axis.
😎 Hyperbola Equation
This paragraph explains the equation used to graph a hyperbola. It is very similar to the ellipse equation but uses a minus sign instead of a plus sign between the terms, representing the constant difference property. The positions of the x and y terms can be swapped to change the orientation. The meanings of the A, B, and C terms are also discussed in relation to hyperbola properties.
👩🏫 Example Problem
This paragraph works through a sample problem using a provided hyperbola equation. It identifies the vertices at x = +/- 4 and foci at x = +/- 5 based on the A and C terms. It then sketches the hyperbola using this information. It also shows how swapping the x and y terms leads to a vertically oriented hyperbola.
📐 Drawing Tips
This paragraph provides tips for sketching hyperbolas. Drawing asymptotes as dotted lines can help guide the hyperbola branches. It also discusses transforming hyperbolas by shifting the center point, similar to ellipses. Finally, it mentions dividing through by any leading coefficient to simplify non-standard form equations.
Mindmap
Keywords
💡hyperbola
💡foci
💡asymptotes
💡standard form
💡transverse axis
💡conic section
💡equation
💡graph
💡transformation
💡comprehension
Highlights
First major finding revealed
Innovative methodology presented
Key theoretical contribution discussed
Notable practical application demonstrated
Transcripts
5.0 / 5 (0 votes)
Thanks for rating:


