Variance and Standard Deviation: Sample and Population Practice Statistics Problems
TLDRThe video script introduces measures of variation, focusing on calculating variance and standard deviation from a data set. It uses the analogy of children's ages at a party to explain how to determine the mean and then apply formulas to find the sample standard deviation and variance. The process involves squaring the differences from the mean, summing these values, and then dividing by the sample size minus one for standard deviation, and squaring the standard deviation for variance. The script also touches on the concepts of population standard deviation and variance, emphasizing the importance of understanding variation in data.
Takeaways
- 📈 The video discusses measures of variation, specifically focusing on variance and standard deviation.
- 🔢 To calculate standard deviation, one must first find the mean (average) of the data set.
- 🧾 The mean is calculated by summing all values and dividing by the sample size.
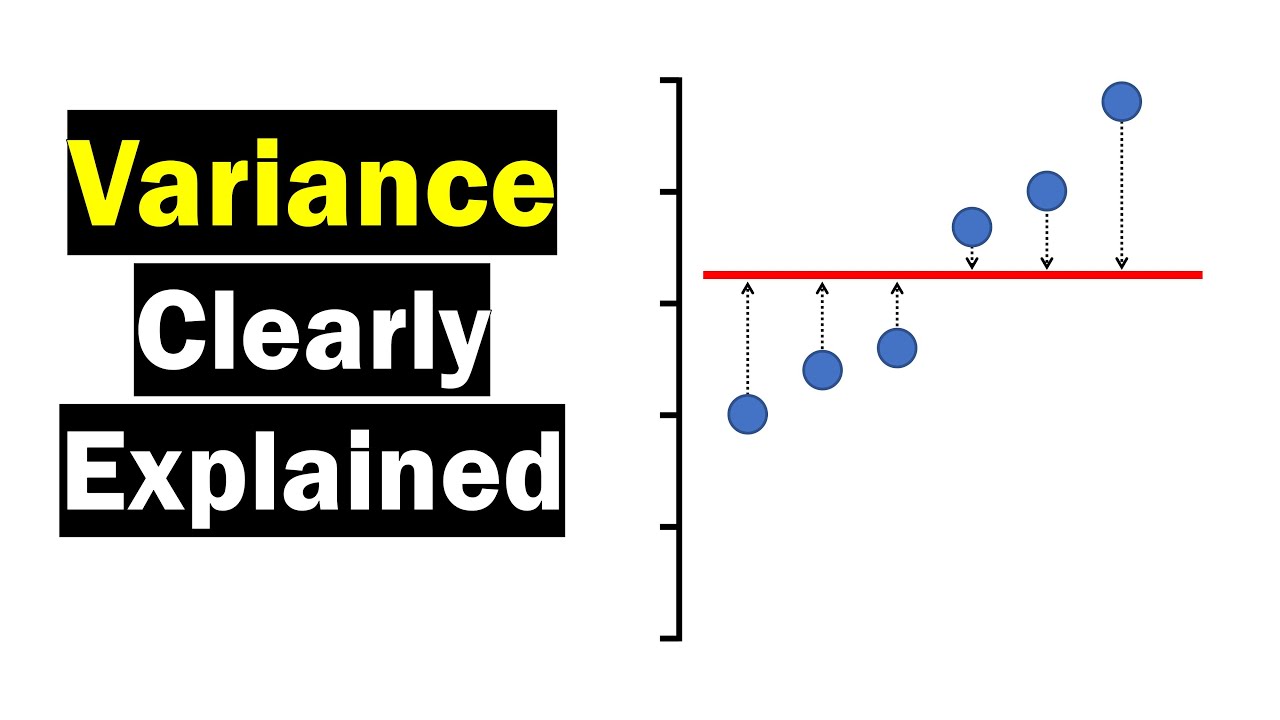
- 📊 Variance measures the consistency of data points, indicating how much scores or ages vary.
- 🏀 The video uses a sports analogy, comparing data points to a player's scores per game.
- 👧 The example given involves ages of children at a party: 4, 6, 8, 4, and 10 years old.
- 💡 The sample standard deviation formula is the square root of the sum of sample values minus the sample mean squared, divided by n-1.
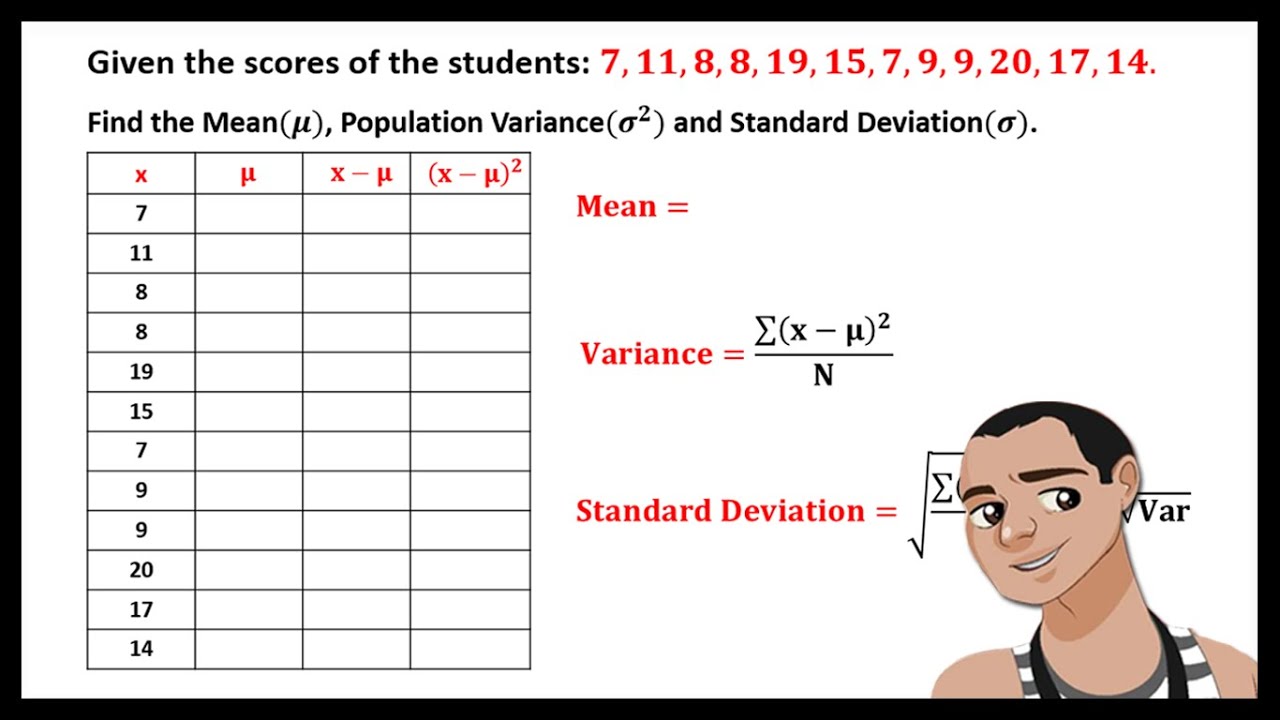
- 📋 A table can be used to organize calculations: listing values, then (value - mean), and finally squaring these differences.
- 🔢 The calculated sample standard deviation for the given data set is approximately 2.6 years.
- 🌟 Variance is the square of the standard deviation and is often not as intuitive as standard deviation due to squared units.
- 🔄 The process for calculating population standard deviation and variance is similar, but uses the population size (N) instead of (n-1).
Q & A
What is the main topic of the video?
-The main topic of the video is to explain how to calculate measures of variation, specifically variance and standard deviation, using a given data set.
How does the video introduce the concept of measures of variation?
-The video introduces the concept of measures of variation by using an analogy of a basketball player's scoring consistency in games, highlighting the need to understand how much the scores vary from game to game.
What is the first step in calculating measures of variation?
-The first step in calculating measures of variation is to find the mean (average) of the data set.
What formula is used to calculate the mean of a data set?
-The formula used to calculate the mean of a data set is the sum of all the values divided by the sample size.
How does the video handle the rounding of the mean?
-The video suggests that the mean should be rounded to one additional decimal place beyond the original data set. If all data points are whole numbers, the mean is rounded to one decimal place.
What is the formula for calculating the sample standard deviation?
-The formula for calculating the sample standard deviation is the square root of the sum of the squared differences between each sample value and the sample mean, divided by the sample size minus one (n-1).
Why is the sample size minus one used in the calculation of sample standard deviation?
-The sample size minus one (n-1) is used in the calculation to account for the bias in the estimation of the population standard deviation from a sample. This is known as Bessel's correction.
How does the video explain the calculation of sample variance?
-The video explains that sample variance is the square of the sample standard deviation, calculated by summing up the squared differences between each sample value and the sample mean, and then dividing by the sample size minus one.
What is the difference between sample standard deviation and population standard deviation?
-Sample standard deviation is based on a sample of the data and uses the sample size minus one in its calculation, while population standard deviation is based on the entire population and uses the full population size in its calculation.
Why is standard deviation preferred over variance for expressing variation?
-Standard deviation is preferred over variance because it is in the same units as the data, making it easier to interpret and understand. Variance, being a squared value, has units that are squared, which can be less intuitive to comprehend.
How does the video illustrate the calculation process?
-null
Outlines
📊 Introduction to Measures of Variation
This paragraph introduces the concept of measures of variation, specifically focusing on variance and standard deviation. It sets the context by referencing a previous video on measures of center and explains the purpose of the current video, which is to calculate variance and standard deviation from a given data set. The scenario involves a hypothetical sampling of children's ages at a party to demonstrate how to calculate these measures. The paragraph emphasizes the importance of understanding consistency and variation in data, using the analogy of a basketball player's scoring to illustrate the concept.
🧮 Calculation of Mean and Sample Standard Deviation
This paragraph delves into the process of calculating the mean and sample standard deviation. It explains the formula for the mean, which is the sum of all values divided by the sample size, and applies this to the given data set to find the mean age of the children. The paragraph then introduces the formula for sample standard deviation, which involves squaring the differences between each value and the mean, summing these squared values, and dividing by the sample size minus one. The detailed step-by-step calculation is provided, including squaring the differences and summing them up, to arrive at the sample standard deviation for the ages of the children at the party.
📈 Understanding Population Standard Deviation and Variance
The final paragraph discusses the concepts of population standard deviation and variance, differentiating them from sample measures. It explains the formulas for both population standard deviation and variance, highlighting the difference in notation and calculation when dealing with an entire population versus a sample. The paragraph uses the same data set but assumes it represents the entire population for the purpose of illustration. It shows how to calculate the population variance and then how to derive the population standard deviation from this value. The explanation includes the rounding rules and the importance of using standard deviation over variance due to the more intuitive units of measurement.
Mindmap
Keywords
💡Measures of Variation
💡Variance
💡Standard Deviation
Highlights
The video discusses measures of variation, specifically focusing on variance and standard deviation.
A hypothetical scenario of kids' ages at a party is used to illustrate the concepts.
The mean (average) age of the kids is calculated to be 6.4 years old.
The standard deviation is introduced as a measure of how consistent the data is.
The formula for sample standard deviation is provided and explained.
A step-by-step method for calculating sample standard deviation is demonstrated.
The importance of rounding the standard deviation according to the data's decimal places is emphasized.
The concept of population standard deviation and variance is introduced.
The difference in notation between sample and population standard deviation is highlighted.
The video provides a clear comparison between sample and population variance.
The practical application of these statistical measures in a real-world context is shown.
The video emphasizes the importance of understanding the consistency of data points.
The process of calculating the mean is quickly reviewed from a previous video.
The video uses a sports analogy to help understand the concept of consistency in data.
A table method for manual calculation of standard deviation is recommended for homework assignments.
The video concludes by wishing the viewers good luck in their study of variation measures.
Transcripts
Browse More Related Video

Statistics: Standard deviation | Descriptive statistics | Probability and Statistics | Khan Academy
MEAN, VARIANCE, AND STANDARD DEVIATION FOR UNGROUPED DATA
Variance - Clearly Explained (How To Calculate Variance)

Standard Deviation and Variance
Variance, Standard Deviation, Coefficient of Variation
Variance and Standard Deviation: Why divide by n-1?
5.0 / 5 (0 votes)
Thanks for rating: