Why do we divide by n-1 and not n? | shown with a simple example | variance and sd
TLDRThis lecture explains the rationale behind dividing by 'n-1' instead of 'n' when calculating sample variance and standard deviation. It clarifies that using 'n-1' ensures the expected value of the sample variance equals the population variance, which is a critical aspect for unbiased estimation. The video uses examples of normally distributed data representing body heights to illustrate the impact of using 'n' versus 'n-1'. It demonstrates that dividing by 'n' underestimates the true population variance, while using the population mean allows for dividing by 'n' without underestimating. The lecture also discusses the concept of degrees of freedom and how it relates to the sample size. Interestingly, it reveals that while the sample variance is an unbiased estimate, the sample standard deviation is biased, particularly for small samples, due to the non-linear transformation of taking the square root. The bias decreases as the sample size increases. The lecture concludes by emphasizing the importance of understanding these statistical concepts for accurate data analysis.
Takeaways
- 🧮 When calculating the sample variance, dividing by \( n - 1 \) instead of \( n \) ensures that the expected value of the sample variance equals the population variance.
- 📊 The use of \( n - 1 \) in the denominator is a mathematical correction to account for the estimation of the mean from the sample, which is not needed when using the true population mean.
- 🚫 Using \( n \) instead of \( n - 1 \) in the calculation of sample variance tends to underestimate the true population variance, especially with small sample sizes.
- 📈 The sample standard deviation, which is the square root of the sample variance, is not an unbiased estimate of the population standard deviation due to the non-linear transformation involved.
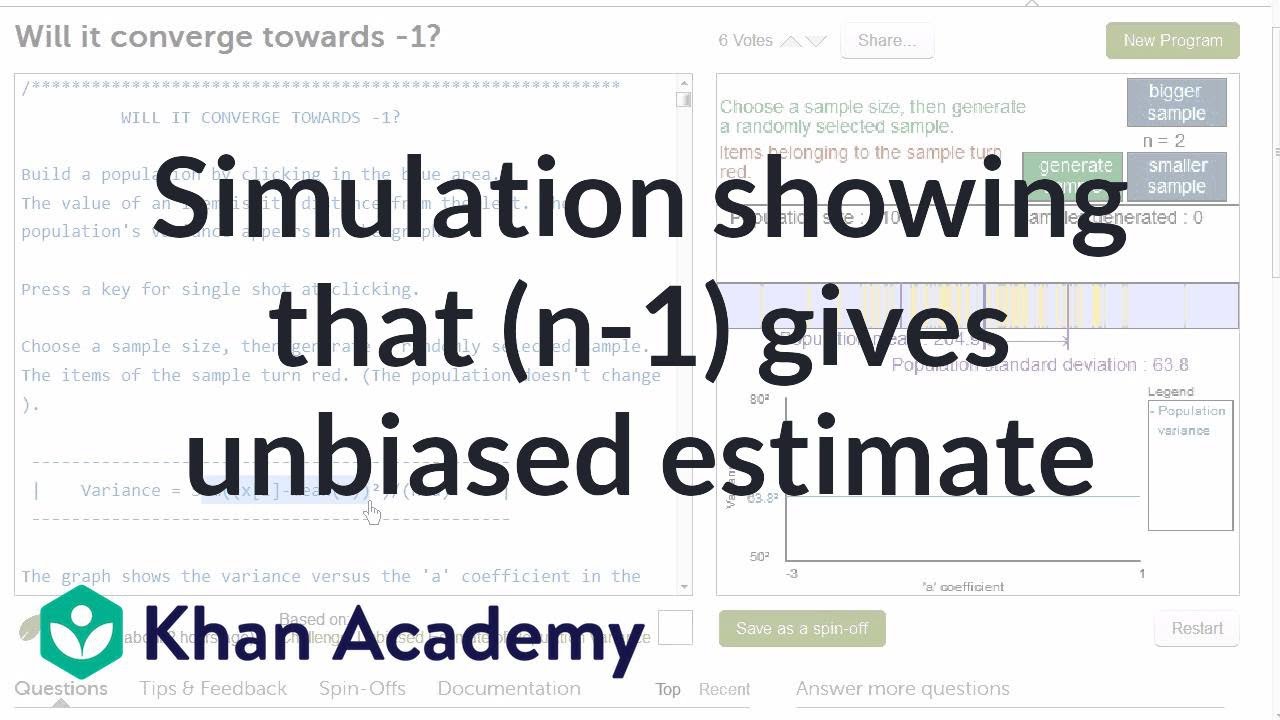
- 🔁 Repeated sampling and calculating the mean of variances from different samples demonstrate that dividing by \( n - 1 \) provides a better estimate of the population variance.
- 🔢 The effect of using \( n - 1 \) instead of \( n \) becomes negligible as sample size increases, making the two formulas approximately equal for large samples.
- 📉 In a simulation with 10,000 samples, the mean of the estimated variances using \( n - 1 \) closely matches the true population variance, whereas using \( n \) results in a significantly lower mean.
- 🤔 The concept of degrees of freedom is introduced as the rationale for subtracting one from the sample size when estimating the variance.
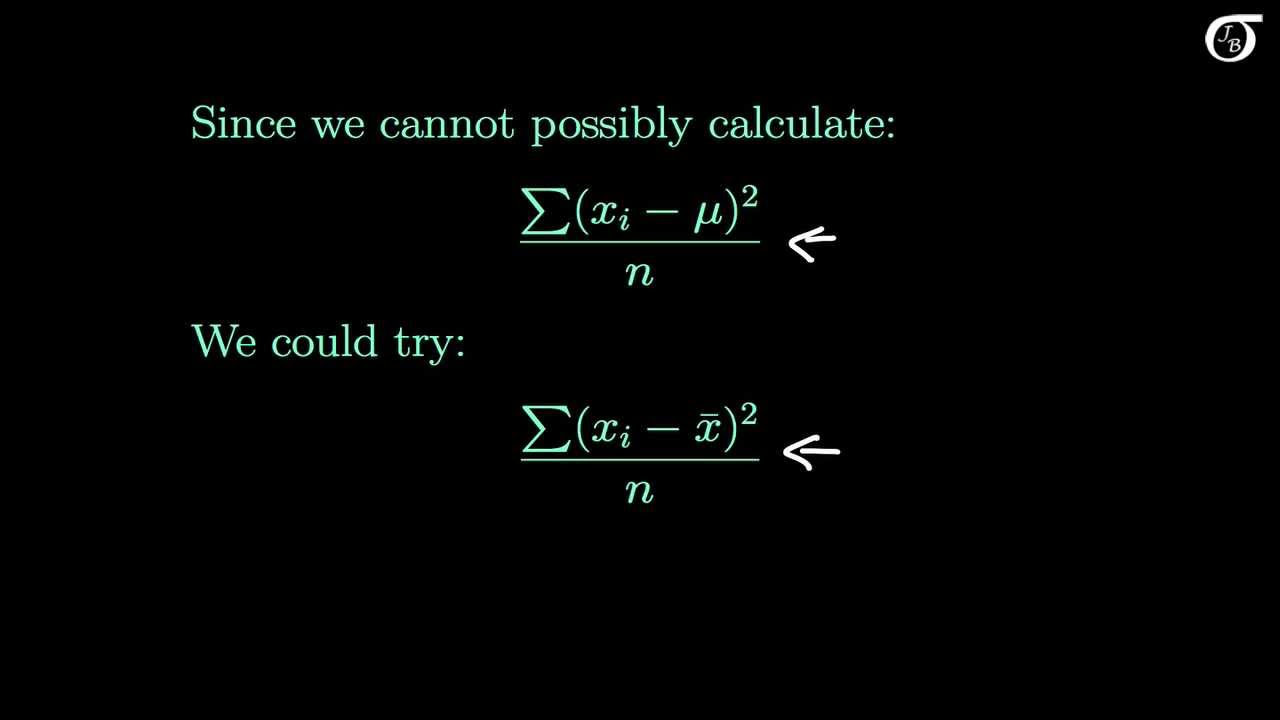
- 🌱 For small samples, the sample mean is often not equal to the population mean, leading to an underestimation of the variance when using the sample mean.
- 📏 The true population mean can be used as a reference point without the need to adjust for degrees of freedom, as it is not estimated from the sample.
- ⏹ The lecture concludes that the use of \( n - 1 \) in variance calculations corrects for the bias introduced by estimating the mean within the sample, aligning the sample variance more closely with the population variance.
Q & A
Why do we divide by n-1 instead of n when calculating sample variance?
-Dividing by n-1 ensures that the expected value of the sample variance is equal to the population variance. This adjustment accounts for the fact that we are estimating the mean from the sample itself, which introduces bias.
What is the mathematical justification for using n-1 in sample variance calculations?
-The mathematical justification involves showing that using n-1 leads to an unbiased estimate of the population variance. This requires complex mathematical proofs and understanding of expected values.
What is the impact of using the population mean instead of the sample mean when calculating variance?
-When using the population mean, it is appropriate to divide by n because we are not estimating the mean from the sample. This results in a better estimate of the population variance, even when dividing by n.
How does the sample size affect the bias in estimating the population variance?
-For small sample sizes, the bias is more significant because the sample mean is less likely to match the population mean. As the sample size increases, the impact of subtracting 1 from the denominator becomes negligible, and the bias decreases.
What is the relationship between the sample variance and the population variance?
-The sample variance is an estimate of the population variance. By dividing by n-1, we aim to make the expected value of the sample variance equal to the population variance, thus reducing bias.
Why is the sample standard deviation not an unbiased estimate of the population standard deviation?
-The sample standard deviation is not unbiased because it is derived from the square root of the sample variance, which is a non-linear transformation. This introduces additional bias, especially for small samples.
How does the sample mean's deviation from the population mean affect the variance calculation?
-If the sample mean deviates from the population mean, the distances of the data points to the sample mean will be shorter than to the population mean. This leads to an underestimation of the population variance when using the sample mean.
What is the concept of degrees of freedom in the context of variance estimation?
-Degrees of freedom refer to the number of independent values that can vary in the calculation. When estimating the variance, we lose one degree of freedom because we use the sample mean, hence we divide by n-1.
How does the sample size affect the accuracy of the sample standard deviation as an estimate of the population standard deviation?
-As the sample size increases, the bias in estimating the population standard deviation decreases. For larger samples, the underestimation becomes minimal, making the sample standard deviation a more accurate estimate.
Can statistical tests adjust for the bias in estimating the population standard deviation?
-Yes, statistical tests can include adjustments for the bias introduced by using the sample standard deviation as an estimate of the population standard deviation, especially for small samples.
Outlines
📚 Understanding Sample Variance Calculation
This paragraph introduces the concept of calculating sample variance and standard deviation. It explains the mathematical rationale behind dividing by n-1 rather than n. The lecturer uses a simple example of normally distributed body heights with a known mean and variance to illustrate the point. The example involves calculating the variance of a sample of four individuals using three different methods: the standard sample variance formula (dividing by n-1), a variant that divides by n, and a method using the population mean. The first method provides a close estimate to the true population variance, while dividing by n underestimates it. Using the population mean with n in the denominator gives a good estimate, which is attributed to the data points being farther from the population mean than the sample mean.
🔍 Bias in Sample Variance and Standard Deviation Estimation
The second paragraph delves into the bias introduced when estimating the population variance using sample data. Through a simulation study involving 10,000 random data sets, it demonstrates that dividing by n-1 provides a better estimate of the population variance compared to dividing by n. The use of the population mean, even when dividing by n, yields a good estimate due to the greater distance of data points from the population mean. The paragraph further explains the concept of degrees of freedom and how subtracting one from the sample size adjusts the variance estimate to avoid underestimation. It also discusses the effect of sample size on the bias, noting that the impact of n-1 diminishes as sample size increases. Additionally, it reveals that while the sample variance is an unbiased estimate of the population variance, the sample standard deviation is biased due to the square root's non-linear transformation, especially for small samples.
👋 Conclusion and Final Thoughts
The final paragraph concludes the lecture by summarizing the importance of dividing by n-1 when calculating the sample variance and standard deviation. It emphasizes that this practice is necessary to adjust for the bias introduced by estimating the mean from the sample. The lecturer expresses hope that the audience now has a clearer understanding of the concept and thanks them for watching the lecture.
Mindmap
Keywords
💡Sample Variance
💡Sample Standard Deviation
💡Population Variance
💡Degrees of Freedom
💡Sample Mean
💡Population Mean
💡Biased Estimate
💡Unbiased Estimate
💡Normal Distribution
💡Simulation Study
Highlights
Discussion of why we divide by n-1 instead of n when calculating sample variance and standard deviation.
Explanation that dividing by n-1 ensures the expected value of the sample variance equals the population variance.
Introduction of a normally distributed variable representing body heights with a mean of 170 and variance of 49.
Example of selecting 4 random individuals from the population with varying heights.
Calculation of sample variance using three different equations to illustrate the impact of dividing by n vs n-1.
Demonstration that dividing by n-1 provides a closer estimate to the true population variance.
Illustration that dividing by n alone results in an underestimated variance.
Use of population mean in variance calculation allows for division by n.
Simulation study showing the impact of dividing by n vs n-1 on variance estimates over 10,000 iterations.
Finding that dividing by n-1 gives a better estimate of the population variance compared to dividing by n.
Explanation of the bias introduced when estimating variance with the sample mean due to its proximity to data points.
Clarification on the loss of one degree of freedom when estimating the population mean.
Discussion on the diminishing effect of n-1 as sample size increases.
Introduction of the concept that the sample standard deviation is not an unbiased estimate unlike the variance.
Experiment showing that the mean of 10,000 standard deviations is lower than the true population standard deviation.
Explanation of the bias in standard deviation estimates due to its non-linear transformation from variance.
Note on statistical tests' ability to adjust for the bias in standard deviation estimates.
Transcripts
Browse More Related Video
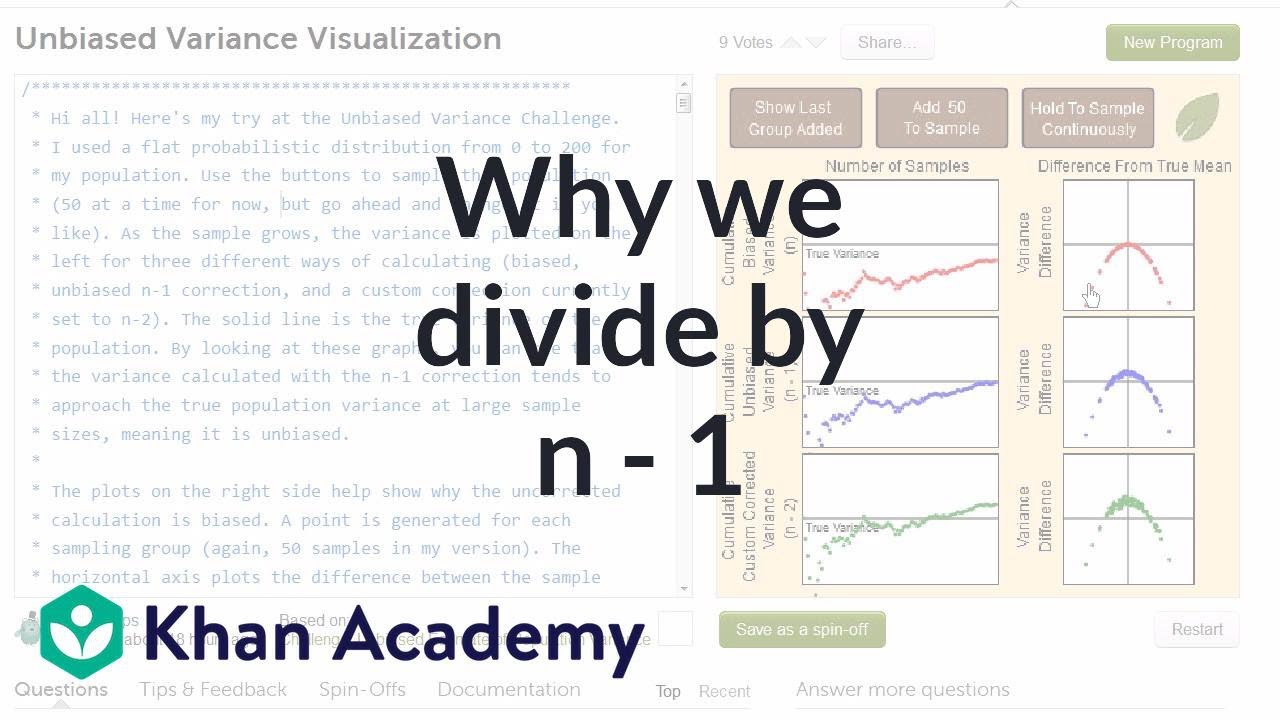
Another simulation giving evidence that (n-1) gives us an unbiased estimate of variance
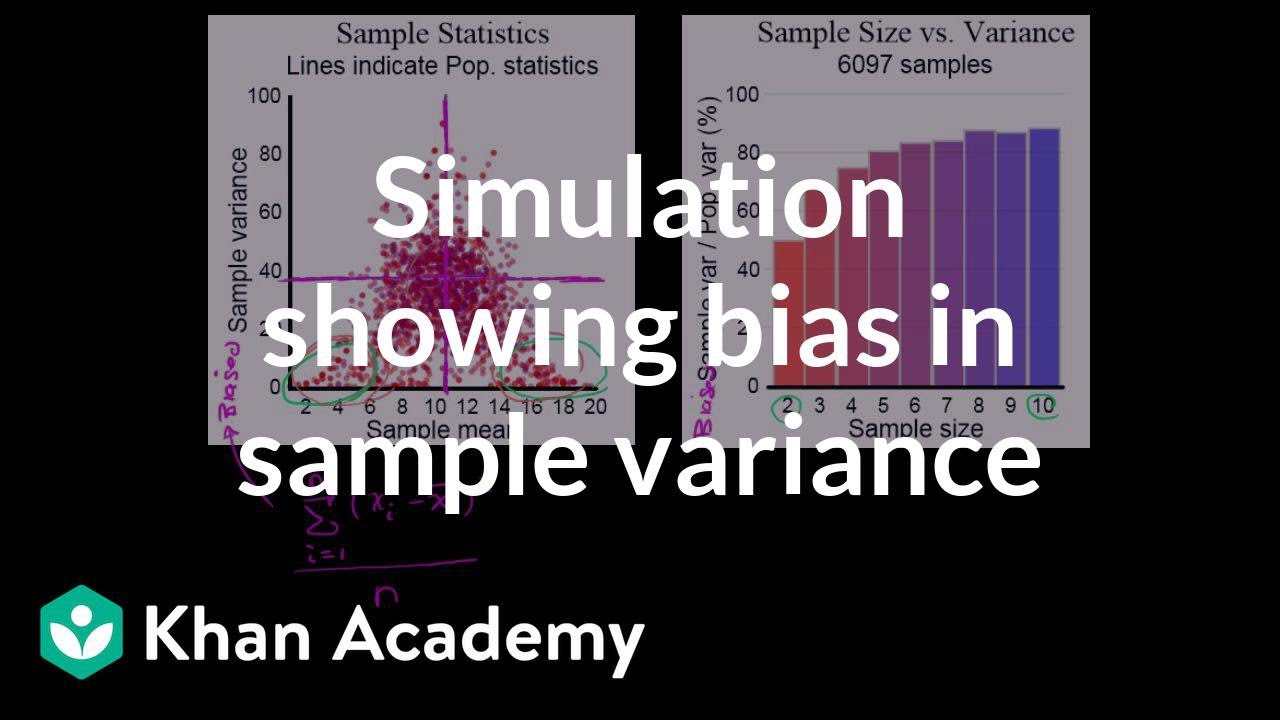
Simulation showing bias in sample variance | Probability and Statistics | Khan Academy
The Sample Variance: Why Divide by n-1?
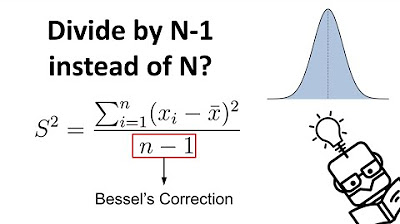
Why We Divide by N-1 in the Sample Variance (Standard Deviation) Formula | The Bessel's Correction
Simulation providing evidence that (n-1) gives us unbiased estimate | Khan Academy
Review and intuition why we divide by n-1 for the unbiased sample | Khan Academy
5.0 / 5 (0 votes)
Thanks for rating: