Solving and Graphing Polynomial and Rational Inequalities
TLDRThe video explains how to solve, graph, and interpret inequalities involving polynomials and rational functions. It starts with solving polynomial inequalities by combining terms, treating as an equation, finding zeroes, and testing points to determine valid intervals. It then covers graphing polynomial inequalities by treating as an equation, graphing, and shading regions above the graph. Next it explains how to solve rational inequalities by finding asymptotes and intercepts, graphing, and determining intervals where the function is positive. Overall, the video provides step-by-step guidance and visuals to help grasp solving, graphing, and comprehending polynomial and rational inequalities.
Takeaways
- 😀 Inequalities state that one side is greater than or less than the other, not equal like equations.
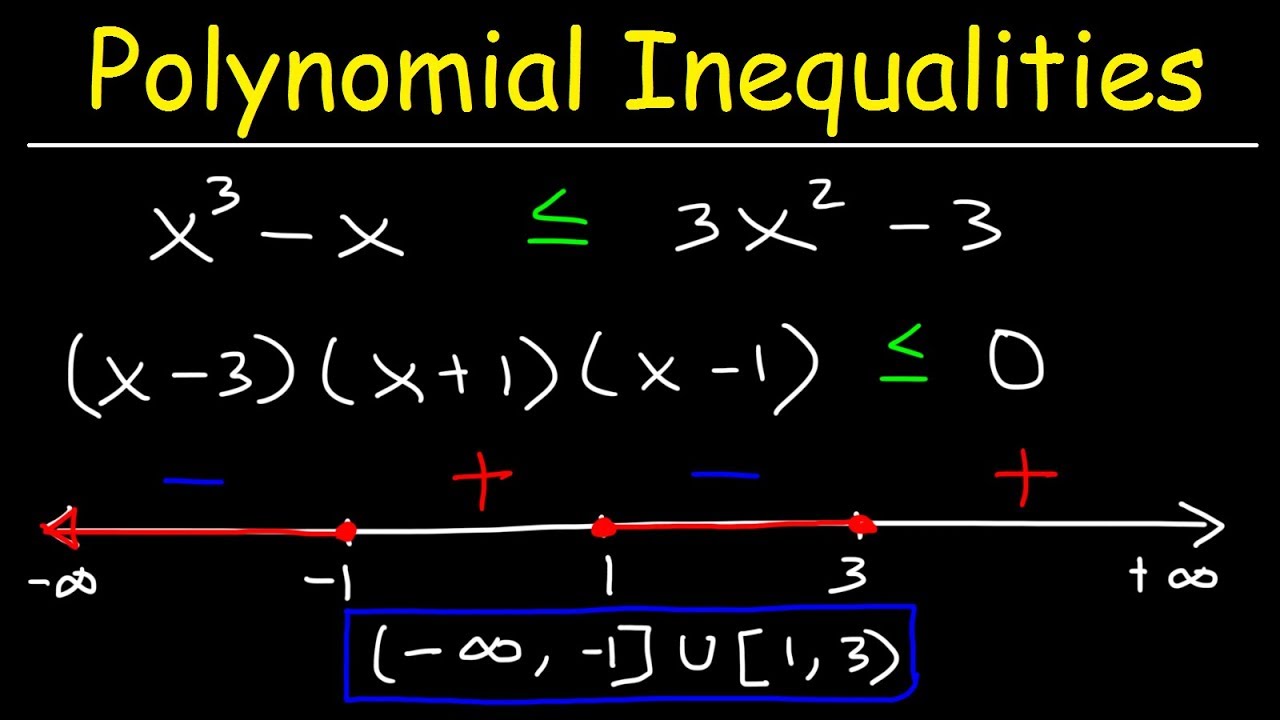
- 😮 To solve complex inequalities, move all terms to one side so the inequality is greater than/less than 0.
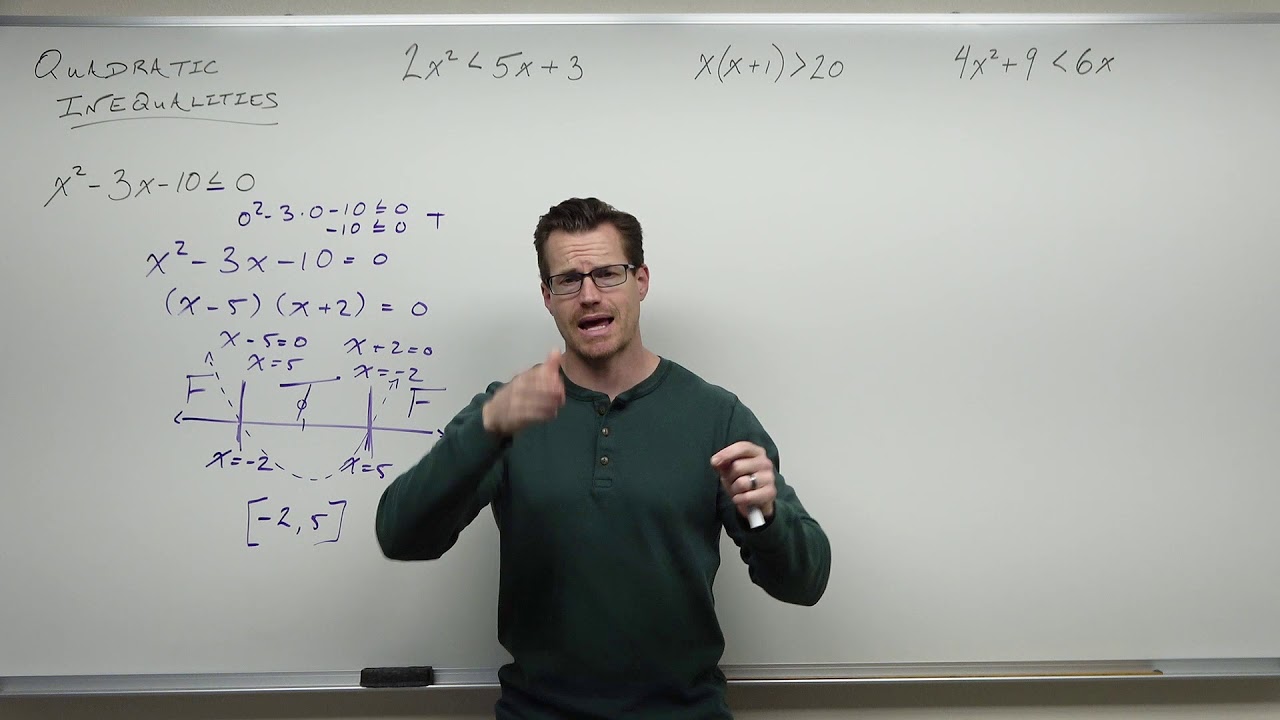
- 📈 Solve the resulting equation, then test points between solutions to see which intervals satisfy the inequality.
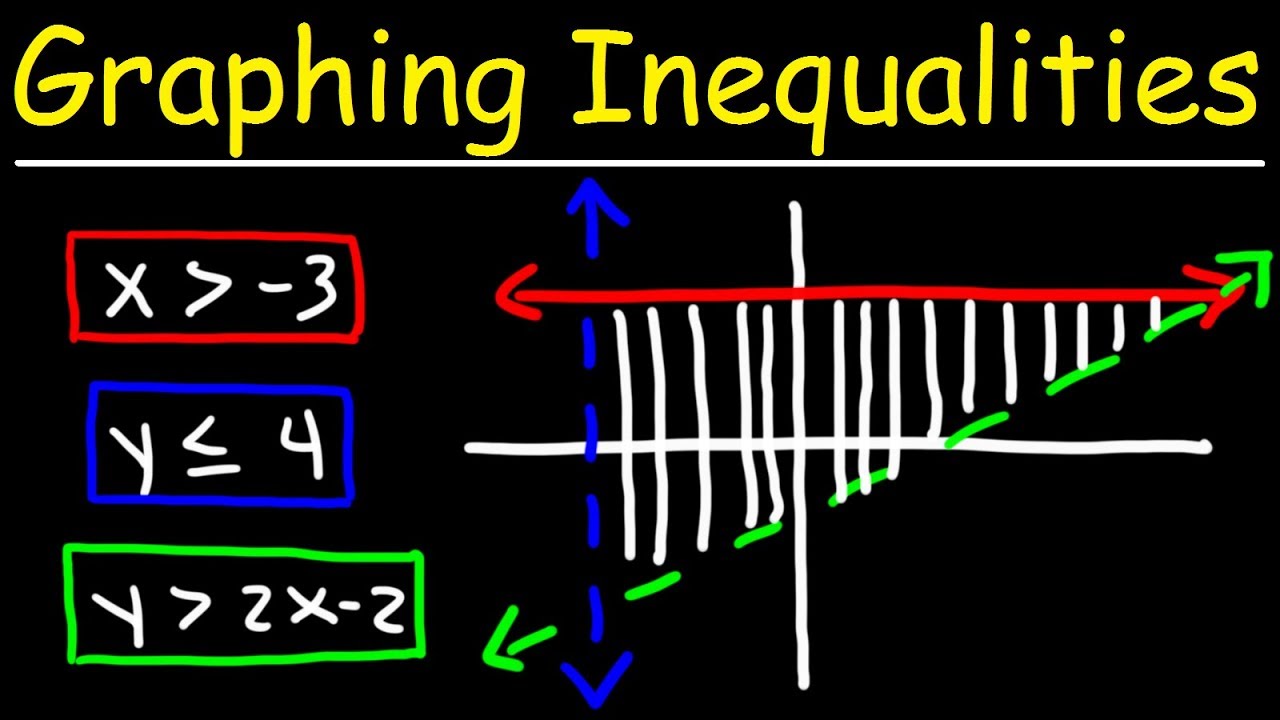
- 📊 Graphing inequalities with two variables involves treating it like an equation first to plot, then shading above/below.
- 🔼 For Y ≥ X + 2, shade above the line since Y must be ≥ the line's Y value for each X.
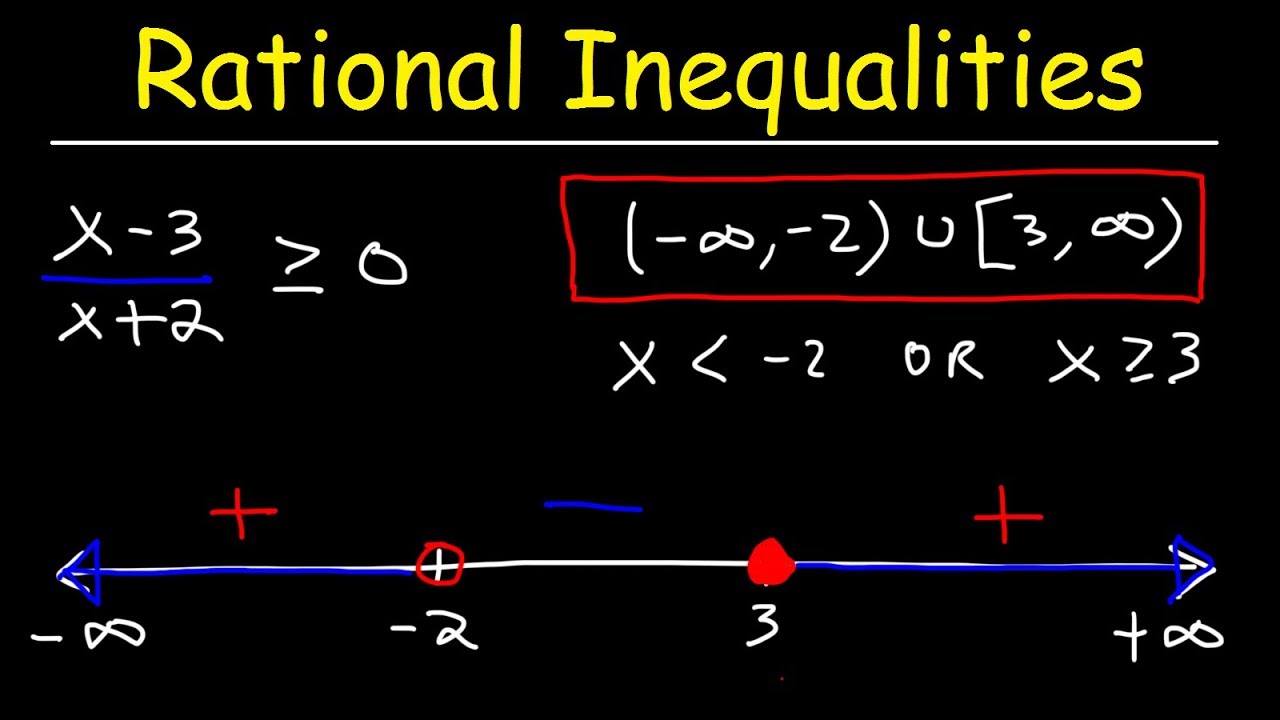
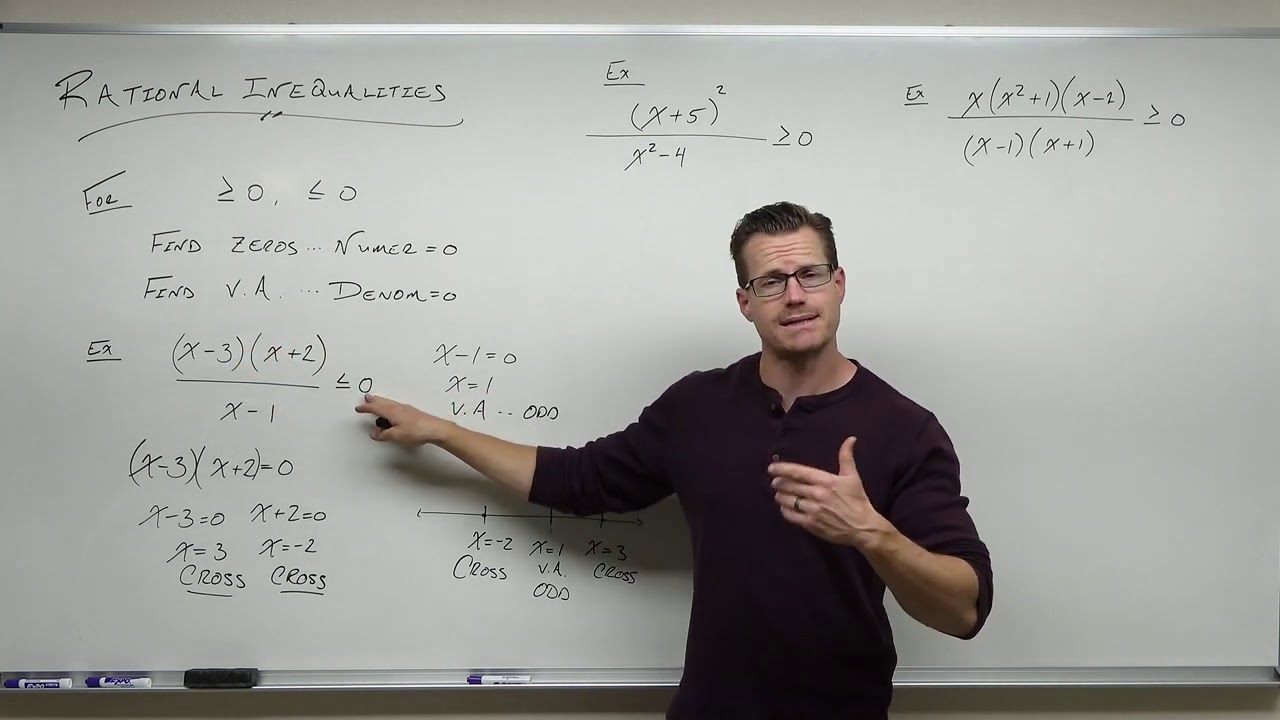
- 📉 Solve rational inequalities by finding zeros, asymptotes, testing points to sketch, then see where >/</= 0.
- ✏️ Graph polynomial and rational inequalities by sketching the function, then shading regions above/below/between zeros.
- 💡 Solve inequalities by treating =, solve the equation, then determine which intervals actually satisfy the <, >, ≤, ≥.
- 🤓 Use interval notation with parentheses for exclusive endpoints, brackets for inclusive endpoints when expressing solutions.
- 🧮 This covers the key ideas for solving and graphing polynomial and rational inequalities.
Q & A
How is graphing inequalities similar to graphing functions?
-Graphing inequalities is extremely similar to graphing functions. The key differences are that inequalities allow for multiple solutions rather than just one, and the graph shows the regions where the inequality is satisfied rather than just plotting a single line or curve.
What is the process for solving more complex inequalities algebraically?
-To solve more complex inequalities algebraically: 1) Get all terms on one side so the inequality is greater than or less than 0. 2) Treat the inequality like an equation and solve it. 3) Test points from the different intervals between solutions to see which satisfy the original inequality.
How do you graph a polynomial inequality with two variables?
-To graph a polynomial inequality with two variables, first treat it like an equation and graph the corresponding line or curve. Then determine which side of the graph satisfies the inequality and shade in that region.
What are the steps for solving and graphing a rational inequality?
-For a rational inequality: 1) Find the x-intercept(s) by setting equal to 0. 2) Find vertical asymptotes. 3) Graph function by testing points. 4) Shade region(s) where function is greater than or less than 0 per the inequality.
What notation is used to show the solution set to an inequality?
-Parentheses or brackets are used to denote inclusive or exclusive endpoints for the solution intervals. The union symbol (U) is used to combine multiple intervals that satisfy the inequality.
What is the difference between an equation and an inequality?
-An equation states two expressions are equal to one another. An inequality states one expression is greater than or less than another expression.
What are some examples of symbols used in inequalities?
->, <, ≥, ≤ are symbols used in inequalities to indicate greater than, less than, greater than or equal to, and less than or equal to.
What is an example of an interval notation for the solution to an inequality?
-(-∞, 3) U (5, ∞) indicates the solution includes all real numbers less than 3 together with all real numbers greater than 5.
How do you determine if a point satisfies an inequality?
-Plug the point into the original inequality to see if it makes the inequality a true statement. If so, the point satisfies the inequality.
Can a quadratic inequality have more than two intervals as solutions?
-Yes, a quadratic inequality can have up to three intervals as solutions depending on whether it crosses the x-axis once or twice.
Outlines
😀 Graphing Inequalities
This paragraph introduces inequalities, explaining how they differ from equations in that one side is greater or less than the other. It covers how to solve basic inequalities algebraically, by isolating the variable on one side. It then demonstrates how to graph the solution on a number line by testing points from different intervals.
😀 Graphing Polynomial Inequalities
This paragraph explains how to solve more complex polynomial inequalities algebraically. It involves moving all terms to one side, factoring if needed, finding roots, and testing points from intervals between roots to determine which satisfy the inequality. It also covers graphing inequalities with two variables, treating them as equations first and then shading the region above or below the graph line.
😀 Graphing Rational Inequalities
This paragraph demonstrates how to solve and graph rational inequalities. It involves finding zeros, asymptotes, and sketching the function to determine intervals where it is above or below the x-axis. Those intervals that satisfy the >0 or <0 condition are the solution regions to shade.
Mindmap
Keywords
💡inequality
💡graphing
💡number line
💡interval notation
💡shading
💡vertical asymptote
💡X-intercept
💡polynomial inequality
💡rational inequality
💡solving
Highlights
Dr. Smith discusses innovative imaging techniques to visualize neuroinflammation.
Novel methods proposed to modulate microglia activation states to reduce neuroinflammation.
Key discoveries uncovered on the role of TREM2 signaling in microglia function and implications for Alzheimer's disease.
Exciting therapeutic targets proposed for restoring homeostatic microglia function in neurodegenerative diseases.
Discussion of cutting-edge tools like CyTOF and imaging mass cytometry enabling single-cell analysis.
Explanation of how bioenergetic deficits may drive microglia to a hyperinflammatory state.
Novel findings on mitochondria transfer from astrocytes modulating microglia function.
Breakthroughs in understanding microglia heterogeneity and region-specific roles.
Importance highlighted of understanding microglia across the lifespan from development to aging.
Discussion of targeting peripheral macrophages to attenuate neuroinflammation.
Significance of data-driven approaches and bioinformatics to uncover microglia phenotypes.
Nanotechnology innovations proposed for targeted delivery of immunomodulatory therapeutics.
Emphasis on understanding interactions between microglia and other CNS cell types.
Potential clinical translation highlighted for diagnostic and therapeutic applications.
Call for integrated, collaborative approaches to uncover microglia biology in neurodegeneration.
Transcripts

5.0 / 5 (0 votes)
Thanks for rating: