Measures of Spread & Variability: Range, Variance, SD, etc| Statistics Tutorial | MarinStatsLectures
TLDRThis video delves into various measures of variability and spread in statistical data, emphasizing the importance of understanding data's range and distribution. It introduces the concepts of range, interquartile range (IQR), sample variance, and sample standard deviation (SD), explaining their calculations and interpretations. The video highlights the sensitivity of these measures to outliers and their role in estimating the average deviation of data points from the mean, providing a foundational understanding for further statistical analysis.
Takeaways
- 📈 The range is a basic measure of variability, calculated as the maximum value minus the minimum value in a data set.
- 📊 Interquartile Range (IQR) measures the middle 50% of data by subtracting the first quartile (25%) from the third quartile (75%), providing a trimmed range.
- 🔢 The sample variance (s^2) is the average of the squared differences from the mean, representing how far individual data points deviate from the sample mean.
- 🌟 The sample standard deviation (SD) is the square root of the sample variance, offering a measure of average deviation from the mean that is more interpretable.
- 📉 Variance and standard deviation are sensitive to outliers, as extreme values can significantly affect their calculations.
- 📌 When calculating variance and standard deviation, the formula typically involves dividing by n-1 (where n is the sample size), not n, to estimate the population parameters from a sample.
- 🔑 The concepts of quartiles, percentiles, and quantiles are important for understanding the distribution of data and are used in calculating IQR and other statistical measures.
- 🎯 The video emphasizes understanding the concepts behind statistical measures rather than getting caught up in the calculations.
- 🛠️ It is recommended to use software for calculating variance and standard deviation, as manual calculation is not practical.
- 🌐 For population data, the variance is denoted by Sigma squared (Σ^2), while for sample data, it is denoted by s^2.
- 📝 The video script serves as an educational tool to build a conceptual understanding of statistical measures of variability and their applications.
Q & A
What is the primary focus of the video?
-The primary focus of the video is to discuss different measures of variability or spread in statistics, emphasizing the concepts rather than the calculations.
What is the range and how is it calculated?
-The range is a measure of variability that represents the full span of the data. It is calculated by subtracting the minimum value from the maximum value in a dataset.
Why is the range not very useful in analytic techniques?
-The range is not very useful in analytic techniques because it only considers the maximum and minimum values, which can be influenced by outliers and do not provide a comprehensive view of the data's variability.
What is the interquartile range (IQR) and how is it defined?
-The interquartile range (IQR) is a measure of spread that represents the range of the middle 50% of ordered data. It is calculated by subtracting the first quartile (25% of data below) from the third quartile (75% of data below).
How is the IQR related to the sensitivity to outliers?
-The IQR is not sensitive to outliers because it focuses on the middle 50% of the data, effectively trimming off the bottom and top quarters which may contain extreme values.
What is the sample variance and what does it estimate?
-The sample variance is a measure that estimates, on average, how far individual weights deviate from the sample mean. It is calculated by summing the squared differences between each data point and the mean, and then dividing by the number of observations minus one.
What is the difference between sample variance and population variance?
-Sample variance is an estimate based on a sample of data and is denoted by the symbol s^2. Population variance, on the other hand, is the true measure of variability for the entire population and is denoted by the Greek letter Sigma squared (Σ^2).
How is the sample standard deviation related to the sample variance?
-The sample standard deviation is the square root of the sample variance. It provides a measure of average deviation in the same units as the original data, making it more interpretable than the variance.
Why is the sample standard deviation sensitive to outliers?
-The sample standard deviation is sensitive to outliers because extreme values can significantly affect the squared differences from the mean, which in turn increases the variance and subsequently the standard deviation.
What is the population standard deviation and how is it denoted?
-The population standard deviation is the true measure of variability for an entire population and is denoted by the Greek letter Sigma (Σ).
Why is it important to understand the concepts behind statistical measures rather than just the formulas?
-Understanding the concepts behind statistical measures is important because it allows for a better grasp of what the measures are estimating and how they can be applied in analysis. It also helps in interpreting the results correctly and making informed decisions based on the data.
Outlines
📊 Introduction to Measures of Variability
This paragraph introduces the concept of variability in statistics, emphasizing the importance of understanding how variable observations are. It outlines the plan to discuss different measures of variability and their calculations, while focusing more on the concepts than the actual calculations. The video uses the example of weights of eight individuals to illustrate these measures, starting with the simplest measure, the range, which is the difference between the maximum and minimum values in the data set.
📈 Interquartile Range and Sensitivity to Outliers
The second paragraph delves into the interquartile range (IQR), explaining it as the difference between the third and first quartiles. It highlights the IQR's ability to represent the range of the middle 50% of the data, making it less sensitive to outliers. The paragraph also touches on the different methods of calculating quartiles and emphasizes the importance of understanding what the IQR estimates rather than getting caught up in the exact calculations.
📝 Calculation and Interpretation of Sample Variance
This paragraph introduces the sample variance, denoted as s^2, and explains the concept behind it, which is to estimate the average distance of individual weights from the sample mean. The formula for calculating the sample variance is presented, and the paragraph explains the process of squaring the deviations from the mean and then averaging them. It also notes the sensitivity of the variance to outliers and the difference between sample variance and population variance.
📊 Understanding Sample Standard Deviation
The final paragraph discusses the sample standard deviation (SD), which is the square root of the sample variance. It provides a conceptual understanding of the standard deviation as the average deviation of individual weights from the mean. The paragraph emphasizes the standard deviation's sensitivity to outliers and its role in capturing the average difference from the mean. It concludes with a reminder that while the formulas are important for understanding the concepts, they are typically calculated using software rather than by hand.
Mindmap
Keywords
💡Variability
💡Range
💡Interquartile Range (IQR)
💡Quartiles
💡Sample Variance
💡Sample Standard Deviation (SD)
💡Outliers
💡Sample Mean
💡Population Variance and Standard Deviation
💡Statistical Formulas
Highlights
The video discusses different measures of variability or spread, focusing on concepts rather than calculations.
A reminder is given to subscribe and click on the bell for notifications of new video uploads.
Statistics involves estimating the variability of observations to understand how variable they are.
The concept of estimating how far an estimate is from the true or population value is introduced.
The range, defined as the maximum value minus the minimum value, is the simplest measure of variability discussed.
In the example, the range is calculated as 104 minus 50, equaling 54 kilograms.
The range provides an idea of the full span of the data, from largest to smallest values.
The interquartile range (IQR) is introduced as the third quartile minus the first quartile.
IQR represents the range of the middle 50% of ordered data, making it less sensitive to outliers.
The sample variance is explained as a measure of how far individual weights deviate from the sample mean.
The formula for sample variance is presented, emphasizing the squaring of deviations from the mean.
The sample standard deviation is introduced as the square root of the sample variance.
The standard deviation is conceptualized as the average deviation of individuals from the mean.
The units of sample variance are squared units, indicating sensitivity to outliers.
The population variance is denoted by Sigma squared, distinguishing it from sample estimates.
The video emphasizes the importance of understanding the concepts behind statistical measures over memorizing formulas.
A reminder that manual calculation of standard deviations is discouraged in favor of using software.
The video concludes with a teaser for more content and a playful comparison of physics to the beauty of a unicorn.
Transcripts
Browse More Related Video
Measures of Dispersion (Ungrouped Data) | Basic Statistics
Range, variance and standard deviation as measures of dispersion | Khan Academy

Measures of Variability (Range, Standard Deviation, Variance)
Understanding Standard deviation and other measures of spread in statistics

Math 119 Chapter 3 part 2
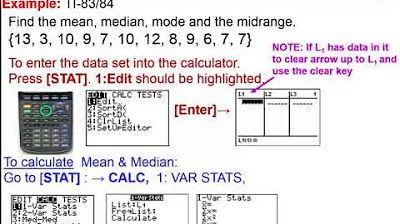
Elementary Statistics - Chapter 3 Describing Exploring Comparing Data Measure of Central Tendency
5.0 / 5 (0 votes)
Thanks for rating: