Elementary Statistics - Chapter 3 Describing Exploring Comparing Data Measure of Central Tendency
TLDRThis script offers an in-depth tutorial on statistical measures of central tendency, including mean, median, mode, and mid-range. It explains how to calculate each, their advantages and disadvantages, and how they can be affected by outliers. The video also covers the TI-83/84 calculator's use for these calculations, introduces weighted mean, frequency distribution, and distribution shapes, and discusses range, deviation, variance, and standard deviation. It concludes with a guide on quartiles, interquartile range, and identifying outliers.
Takeaways
- 📊 The script discusses measures of central tendency, including mean, median, mode, and mid-range, explaining how to calculate them and their significance in data analysis.
- 🔢 The mean is calculated by summing all data entries and dividing by the number of entries, with different symbols used for population mean (μ) and sample mean (x̄).
- 📈 The median is the middle value in an ordered data set, with different calculations for odd and even numbers of data entries.
- 🏷️ The mode is the most frequently occurring data entry, with special considerations for no mode or bimodal scenarios.
- 📉 Outliers are data points that are significantly different from the rest and can greatly affect the mean but not the median or mode.
- 📚 The script provides a step-by-step guide on how to use TI-83/84 calculators to calculate measures of central tendency, including entering data and using the correct menu options.
- 📉 Weighted mean is introduced as the mean of a data set with varying weights, calculated by summing the products of data values and their weights, then dividing by the sum of weights.
- 📊 The mean of a frequency distribution is calculated using midpoints of classes and their corresponding frequencies, dividing the sum of products by the total number of data pieces.
- 📈 Distribution shapes such as positively skewed, symmetrical, and negatively skewed are explained, with the mean being affected by outliers in skewed distributions.
- 🔢 The range is calculated by subtracting the minimum value from the maximum value in a data set, indicating the spread of data points.
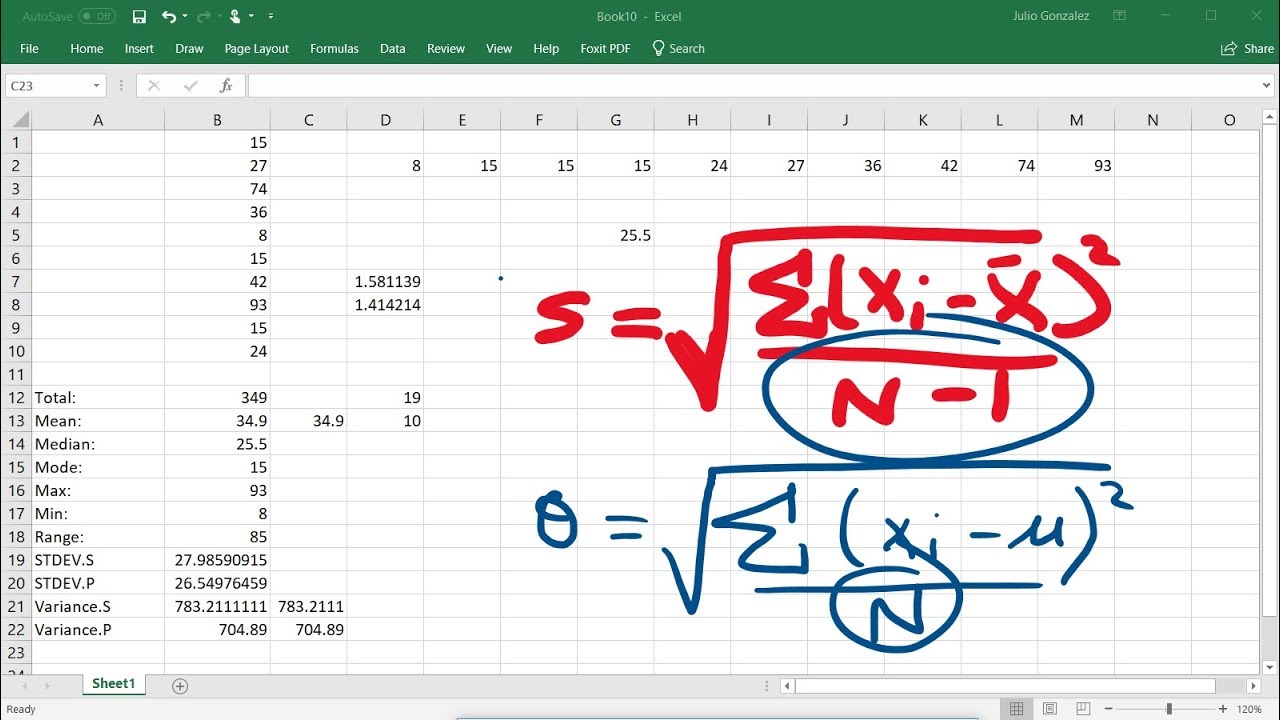
- 📊 The script explains how to calculate variance and standard deviation, which provide insights into the spread of data around the mean, with different formulas for population and sample data.
Q & A
What is the definition of a measure of central tendency?
-A measure of central tendency is a value that represents a typical or central entry of a data set, commonly including the mean, median, and mode.
How is the mean calculated for a population?
-The population mean is calculated by summing all the data entries and dividing by the number of entries, represented by the Greek letter mu (µ).
What symbol is used to represent the sample mean?
-The sample mean is represented by the symbol x-bar (x̄).
How do you find the median of a data set?
-The median is the middle value of a data set when it is ordered. If the data set has an odd number of entries, the median is the middle entry. If it has an even number, the median is the mean of the two middle entries.
What is the mode in statistics?
-The mode is the data entry that occurs with the greatest frequency. A data set can have no mode, one mode, or multiple modes if there are ties for the highest frequency.
What is an outlier in a data set?
-An outlier is a data point that is distinctly separate from the rest of the data set, often significantly affecting measures like the mean.
How is the mid-range of a data set calculated?
-The mid-range is calculated by taking the maximum data value, adding the minimum data value, and then dividing by two.
What is the weighted mean and how is it different from a regular mean?
-The weighted mean is the mean of a data set where each entry has a varying weight. It is calculated by summing the products of the data values and their respective weights, then dividing by the sum of the weights.
How do you calculate the mean for a frequency distribution table?
-To calculate the mean for a frequency distribution, you find the midpoint of each class, multiply it by the frequency, sum these products, and then divide by the total number of data pieces.
What is the range in statistics and how is it found?
-The range is the difference between the maximum and minimum values in a data set, indicating the spread of the data.
How is standard deviation calculated and what does it indicate about a data set?
-Standard deviation is calculated by taking the square root of the variance, which is the average of the squared deviations from the mean. It indicates how closely the values of the data set are clustered around the mean.
What are quartiles and how do they divide a data set?
-Quartiles divide an ordered data set into four equal groups, with approximately 25% of the values in each group. The second quartile (Q2) is the median, while the first and third quartiles (Q1 and Q3) are the medians of the lower and upper halves of the data set, respectively.
What is the interquartile range and how is it used to find outliers?
-The interquartile range (IQR) is the difference between the third and first quartiles (Q3 - Q1). It is used to find outliers by adding and subtracting 1.5 times the IQR from Q1 and Q3, respectively, to determine the lower and upper bounds for potential outliers.
Outlines
📊 Understanding Measures of Central Tendency
This paragraph introduces the concept of measures of central tendency, which are statistical values that represent the center of a data set. It discusses the mean (average), median (middle value), and mode (most frequent value), explaining how to calculate each and their respective symbols for population and sample data. The paragraph also touches on the impact of outliers on the mean and introduces the mid-range as another measure of central tendency. It concludes with a discussion on rounding rules for these measures and an introduction to using calculators, specifically the TI-83 or 84, for calculations.
🔢 Data Entry and Calculation on Calculators
The second paragraph provides a step-by-step guide on entering data into calculators, specifically the TI-83 or 84, and performing calculations to find the mean, median, and mid-range. It explains the process of clearing data, entering new data, and using the 'Stat' and 'Calc' menus to compute these measures. The paragraph also covers how to find the mode, either by observation or using the calculator's sorting function, and emphasizes the importance of applying rounding rules to the calculated values.
🏆 Weighted Mean and Grading Systems
This paragraph delves into the concept of a weighted mean, which is used when different components of a data set have varying importance or 'weights'. It uses the example of a grading system where different assessment types contribute differently to the final grade. The process of calculating the weighted mean is explained, including organizing data, converting percentages to decimals, and entering data into the calculator. The paragraph concludes with an example calculation and a discussion on the importance of correctly identifying the mean for a sample versus a population.
📈 Mean Calculation for Frequency Distributions
The fourth paragraph explains how to calculate the mean for a frequency distribution table, which involves finding the midpoint of each class interval and using these to compute the overall mean. It provides a detailed example of how to find midpoints, multiply them by their respective frequencies, and then divide by the total number of data points to obtain the mean. The paragraph also discusses the importance of correctly placing data into the calculator and the process of calculation.
📉 Distribution Shapes and Statistical Range
This paragraph discusses the shapes that frequency distributions can take, such as positively skewed, symmetrical, and negatively skewed. It explains how the mean, median, and mode are affected by the skewness of the distribution and how outliers can influence these measures. The paragraph also covers the concept of range, which is the difference between the maximum and minimum values in a data set, and provides an example calculation of range using starting salaries of graduates.
📊 Variance and Standard Deviation Basics
The sixth paragraph introduces the concepts of variance and standard deviation, which are measures of the spread or dispersion of a data set. It explains how to calculate the deviation of each data point from the mean and then how to use these to calculate the variance and standard deviation. The paragraph distinguishes between the formulas for population and sample data and discusses the implications of a large or small standard deviation in terms of data spread. It also covers the calculator's process for finding these measures and the rounding rules that apply.
📝 Quartiles, Interquartile Range, and Outliers
The final paragraph discusses quartiles, which divide an ordered data set into four equal parts, and the interquartile range, which is the difference between the third and first quartiles. It explains how to find quartiles using a calculator and how to calculate the interquartile range. The paragraph also covers the method for identifying outliers using the interquartile range and provides an example of how to calculate the lower and upper bounds for outliers. It concludes with an example calculation using the TI-83/84 calculators.
Mindmap
Keywords
💡Measure of Central Tendency
💡Mean
💡Median
💡Mode
💡Outliers
💡Mid-Range
💡Weighted Mean
💡Frequency Distribution
💡Skewness
💡Range
💡Standard Deviation
💡Quartiles
💡Interquartile Range (IQR)
Highlights
Measures of central tendency, including mean, median, and mode, are essential for representing typical data values.
The mean is calculated by summing all data entries and dividing by the number of entries, symbolized by mu for population mean and x-bar for sample mean.
Median is the middle value in an ordered data set, with the formula for even entries being the average of the two middle numbers.
Mode is the most frequently occurring data entry, with bimodal data sets having two modes.
Mean is advantageous as it considers all data points but is heavily influenced by outliers.
Outliers are data points distinctly separate from the rest of the data set, which can skew the mean.
Mid-range is calculated as the value midway between the maximum and minimum values in a data set.
Rounding rules for measures of central tendency involve carrying one more decimal place than in the original data set.
Mode values should not be rounded as they represent original data values.
The TI-83/84 calculators are used to calculate mean, median, mode, and mid-range with step-by-step instructions provided.
Weighted mean accounts for data entries with varying importance, calculated by the sum of data values times their weights divided by the sum of weights.
Examples of calculating a weighted mean include grading systems with different percentages allocated to various components.
Mean for a frequency distribution is found using midpoints of classes and their corresponding frequencies.
Distribution shapes such as positively skewed, symmetrical, and negatively skewed affect the position of the mean relative to the median and mode.
Range is the difference between the maximum and minimum values in a data set, indicating data spread.
Deviation is the difference between each data point and the mean, used to calculate variance and standard deviation.
Variance measures the spread of data points around the mean, with standard deviation being the square root of variance.
Quartiles divide an ordered data set into four parts, with the median (Q2) and interquartile range (IQR) offering insights into data distribution.
Outliers are identified using the IQR and can be determined for both lower and upper extremes of the data set.
Transcripts
Browse More Related Video

Math 119 Chapter 3 part 2

Live Day 2- Basic To Intermediate Statistics

Mode, Median, Mean, Range, and Standard Deviation (1.3)

What is Descriptive Statistics? A Beginner's Guide to Descriptive Statistics!
Calculating The Standard Deviation, Mean, Median, Mode, Range, & Variance Using Excel
Measures of Spread & Variability: Range, Variance, SD, etc| Statistics Tutorial | MarinStatsLectures
5.0 / 5 (0 votes)
Thanks for rating: