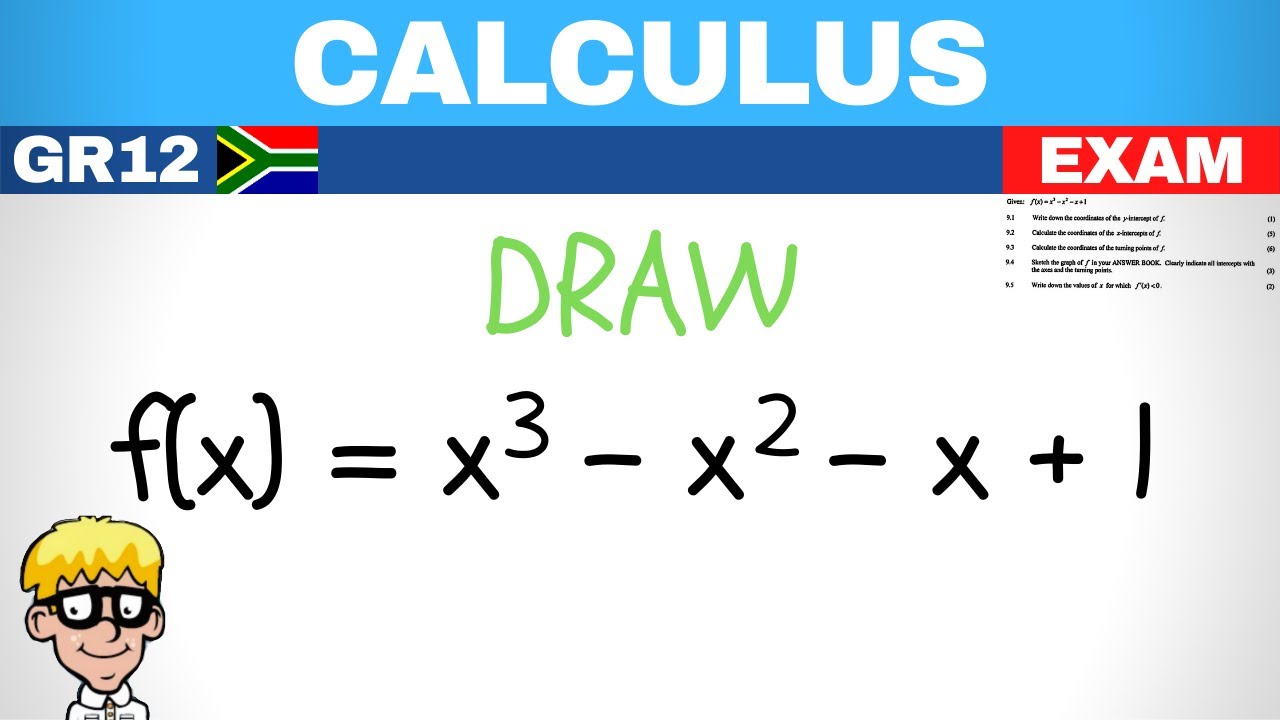
Draw Cubic Graph Grade 12
TLDRThis video script offers a detailed tutorial on sketching a cubic graph. It begins by explaining the importance of identifying key features such as x-intercepts, y-intercept, and turning points. The presenter guides through finding x-intercepts by substituting values into the cubic equation, factorizing it, and solving for 'a', 'b', and 'c'. The y-intercept is determined by setting x to zero, and the turning points are found by solving the first derivative set to zero. The script concludes with plotting these points and sketching the graph, providing a comprehensive approach to understanding cubic functions.
Takeaways
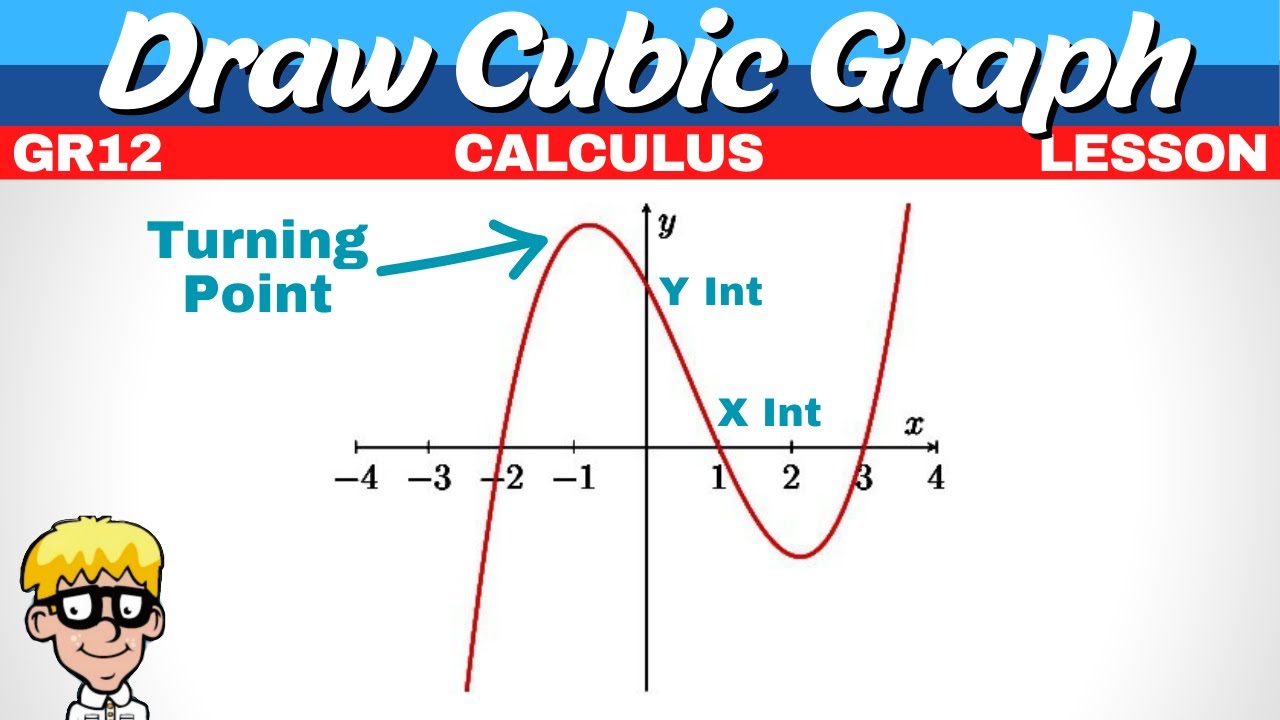
- 🧮 When sketching a cubic graph, it’s essential to identify three x-intercepts, a y-intercept, and two turning points.
- 🖊️ In an exam, it's helpful to create a rough sketch of the graph to visualize the required information.
- 📉 To find x-intercepts, set y to zero and test different x values until the equation equals zero.
- 🧠 If one x-intercept is found, it can be used to factorize the cubic equation into simpler forms.
- 🔄 The cubic equation can be broken down into a product of a linear and a quadratic equation for easier solving.
- 📝 Use the known x-intercept to determine the coefficients of the quadratic equation in the factored form.
- ✏️ After finding the x-intercepts, factorize the quadratic equation to get the remaining roots.
- 📊 The y-intercept is found by substituting x equals zero into the original equation.
- 🔍 Turning points on a cubic graph occur where the gradient (first derivative) equals zero.
- 📈 The x-values of turning points can be found using the quadratic formula, and their corresponding y-values are determined by substituting back into the original equation.
Q & A
What is a cubic graph and why is it important to sketch one in an exam?
-A cubic graph represents a cubic equation, typically of the form y = ax^3 + bx^2 + cx + d. It's important to sketch one in an exam because it helps visualize the function's behavior, including x-intercepts, y-intercept, and turning points, which are key features for understanding the graph's shape and properties.
What are the three key pieces of information needed to sketch a cubic graph?
-The three key pieces of information needed are the x-intercepts, the y-intercept, and the turning points of the graph.
How can you find the x-intercepts of a cubic graph without a cubic formula?
-You can find the x-intercepts by setting y to zero and guessing values for x, then substituting these into the cubic equation until you find values that result in zero, indicating an x-intercept.
What does it mean to factorize a cubic equation after finding an x-intercept?
-Factorizing a cubic equation after finding an x-intercept involves expressing the cubic equation in a form that includes the factor (x - value) that equals zero at the intercept, which helps in breaking down the equation into simpler components to find the remaining roots.
Why is the value of 'a' in the factorized equation simply 1 after finding the first x-intercept?
-The value of 'a' is 1 because when you multiply the factor (x - value) that equals zero at the intercept with the remaining quadratic expression, the coefficient of x^3 in the original cubic equation must match, which is 1 in this case.
How do you determine the values of 'b' and 'c' in the factorized quadratic expression?
-You determine 'b' and 'c' by comparing the coefficients and constant term of the original cubic equation with the expanded form of the factorized expression, ensuring that when the factors are multiplied together, they yield the original cubic equation.
What is the significance of the y-intercept in the context of a cubic graph?
-The y-intercept is the point where the graph crosses the y-axis (when x = 0). It's significant because it provides a reference point on the graph and helps in plotting the initial part of the graph.
How can you find the turning points of a cubic graph?
-Turning points can be found by taking the first derivative of the cubic equation, setting it to zero, and solving for x. These x-values indicate where the gradient (slope) of the graph is zero, indicating a turning point.
Why is the gradient at a turning point of a cubic graph zero?
-The gradient at a turning point is zero because at these points, the graph changes direction, moving from increasing to decreasing or vice versa, which means the rate of change (slope) is momentarily zero.
How do you find the y-values for the turning points after determining the x-values?
-After determining the x-values for the turning points, you substitute these x-values back into the original cubic equation to find the corresponding y-values, which complete the coordinates for the turning points.
What is the final step in sketching a cubic graph after finding all key points?
-The final step is to plot all the key points (x-intercepts, y-intercept, and turning points) on a graph and connect them with a smooth curve that represents the cubic function's behavior.
Outlines
📈 Sketching a Cubic Graph and Finding Intercepts
The paragraph explains the process of sketching a cubic graph, emphasizing the importance of identifying key features such as x-intercepts, y-intercept, and turning points. It details the method of finding x-intercepts by setting y to zero and guessing x values, then using these to factorize the cubic equation. The example provided involves a cubic expression that factors into (x-1)(ax^2+bx+c), where a, b, and c are determined by multiplying the factors back together and matching coefficients. The process includes finding the first x-intercept at x=1, which leads to the factorization of the cubic equation.
📚 Completing the Cubic Equation and Identifying Turning Points
This paragraph continues the process of analyzing the cubic graph by completing the cubic equation after identifying the first x-intercept. It explains how to find the coefficients a, b, and c by considering the original cubic expression and the factorized form. The paragraph also demonstrates how to find the y-intercept by setting x to zero and calculating the resulting y-value. Furthermore, it discusses finding the turning points by setting the first derivative of the cubic equation to zero and solving for x, which gives the x-values of the turning points. The corresponding y-values are then found by substituting these x-values back into the original equation. The paragraph concludes with instructions on how to plot these points on the graph to visualize the cubic function.
Mindmap
Keywords
💡Cubic Graph
💡X-Intercepts
💡Quadratic Formula
💡Factorization
💡Quadratic Trinomial
💡Coefficients
💡Y-Intercept
💡Turning Point
💡Gradient
💡First Derivative
💡Difference of Squares
Highlights
A cubic graph typically has a specific shape with x-intercepts, a y-intercept, and turning points.
To sketch a cubic graph, a rough sketch can help visualize the required information.
Three x-intercepts are essential for a cubic graph.
A y-intercept and two turning points are important features of a cubic graph.
For cubic equations, there is no direct formula like the quadratic formula; instead, x-intercepts are found by trial and error.
The process of finding x-intercepts involves setting y to zero and guessing x values.
Once an x-intercept is found, it can be factorized as x - value.
The remaining part of the cubic equation is a quadratic trinomial after factoring out an x-intercept.
Coefficients a and c of the quadratic part can be determined by multiplying the factorized part with the original cubic term.
Finding the coefficient b involves setting up an equation based on the product of the quadratic part.
The cubic equation can be further factorized into three factors after determining the coefficients.
The y-intercept is found by setting x to zero in the equation.
Turning points on a cubic graph are where the gradient is zero, which corresponds to the first derivative being zero.
The first derivative of a cubic equation is a quadratic equation, which can be solved for x to find turning points.
To find the y-values of turning points, the x-values obtained from the first derivative are substituted back into the original equation.
Plotting the graph involves marking the x-intercepts, y-intercept, and turning points, then connecting them.
The final graph should reflect the cubic nature of the equation with all the calculated points accurately plotted.
Transcripts


5.0 / 5 (0 votes)
Thanks for rating: