Calculus Grade 12 Exam Questions
TLDRThis educational video script guides students through analyzing a given graph of a function 'f(x)', discussing x-intercepts, y-intercept, and turning points. It emphasizes the importance of recognizing when an x-intercept is also a turning point, which counts as two x-intercepts. The script then demonstrates deriving the equation of 'f(x)' from its intercepts, finding the coordinates of a turning point 'N', determining where the graph is below zero, identifying intervals of increase, and explaining concavity. It concludes with finding the maximum vertical distance between the graph of 'f(x)' and its first derivative over a specified interval, using calculus techniques to solve the problem.
Takeaways
- 📈 The script discusses the process of deriving the equation of a function 'f' given its graph, including x-intercepts and turning points.
- 🔍 When a turning point and x-intercept coincide, it is counted as two x-intercepts, which is a crucial concept to remember.
- 📝 The equation of 'f' is constructed using the x-intercepts, with the understanding that 'a' in the equation is the coefficient of the x^3 term, which is 1 in this case.
- 🧩 The x value of the turning point 'M' is determined to be -1 by substituting the y value into the derived equation and solving for 'xm'.
- ✅ The method of using brackets to represent the x-intercepts is reiterated, emphasizing the importance of including all relevant x values in the equation.
- 📚 The process of finding the turning point 'N' involves taking the first derivative of the function and setting it to zero to solve for the x-coordinate.
- 📉 The script explains how to determine where the graph of 'f' is below the x-axis by identifying intervals where the y-values are negative.
- 📈 To find where the graph is increasing, the intervals are identified by looking at the graph's slope and determining where it is positive.
- 😃 The concept of concavity is introduced, with 'concave up' corresponding to the graph's 'happy' sections where the second derivative is positive.
- 🔢 The maximum vertical distance between the graph of 'f' and its first derivative is calculated by finding the vertex of the parabola formed by the first derivative.
- 📊 The final calculation involves taking the first derivative of the vertical distance equation and setting it to zero to find the x-value where the maximum occurs.
Q & A
What is the significance of a point being both an x-intercept and a turning point in the context of this script?
-When a point is both an x-intercept and a turning point, it counts as two x-intercepts. This is important for determining the factors of the function's equation.
How does the script suggest finding the equation of a function given its x-intercepts and y-intercept?
-The script suggests using the x-intercepts to create a set of brackets in the form of (x - x1)(x - x2)... and then multiplying these out to find the function's equation, taking into account the y-intercept as well.
What is the y-intercept of the function discussed in the script, and how is it used in the equation?
-The y-intercept is denoted as 'K' in the script. It is used as the leading coefficient 'a' in the equation when the x-intercepts are substituted into the function's form.
How does the script explain the process of finding the x-value of point M, which is a turning point and x-intercept?
-The script explains that since M is both a turning point and an x-intercept, it counts as two x-intercepts. By substituting the y-value at the x-intercept into the equation and solving, the x-value of M is found to be -1.
What is the method described in the script for finding the coordinates of the turning point N?
-The script describes finding the turning point N by taking the first derivative of the function's equation, setting it to zero, and solving for x. Then, substituting this x-value back into the original function to find the corresponding y-value.
How does the script define the intervals where the graph of the function is below the x-axis?
-The script defines the intervals as being from negative infinity up to x = -1 (not including -1) and from x = -1 up to x = 3 (not including 3), where the y-values of the graph are negative.
What does the script say about the intervals where the graph of the function is increasing?
-The script states that the graph is increasing for x values less than -1 (not including -1) and for x values greater than 5/3 (not including 5/3).
How does the script determine where the graph is concave up?
-The script determines that the graph is concave up by finding the second derivative of the function's equation, setting it to zero to find the inflection point, and stating that the graph is concave up to the right of this point.
What is the approach described in the script for finding the maximum vertical distance between the graph of the function and its first derivative?
-The script suggests finding the first derivative of the function, determining the vertical distance between the function and the derivative by subtracting the derivative from the function, and then finding the maximum of this distance by taking the derivative of the distance equation and setting it to zero.
How does the script calculate the maximum vertical distance between the two graphs?
-The script calculates the maximum vertical distance by taking the first derivative of the vertical distance equation, setting it to zero to find critical points, and then plugging these x-values back into the vertical distance equation to find the maximum value.
Outlines
📚 Introduction to Graph Analysis
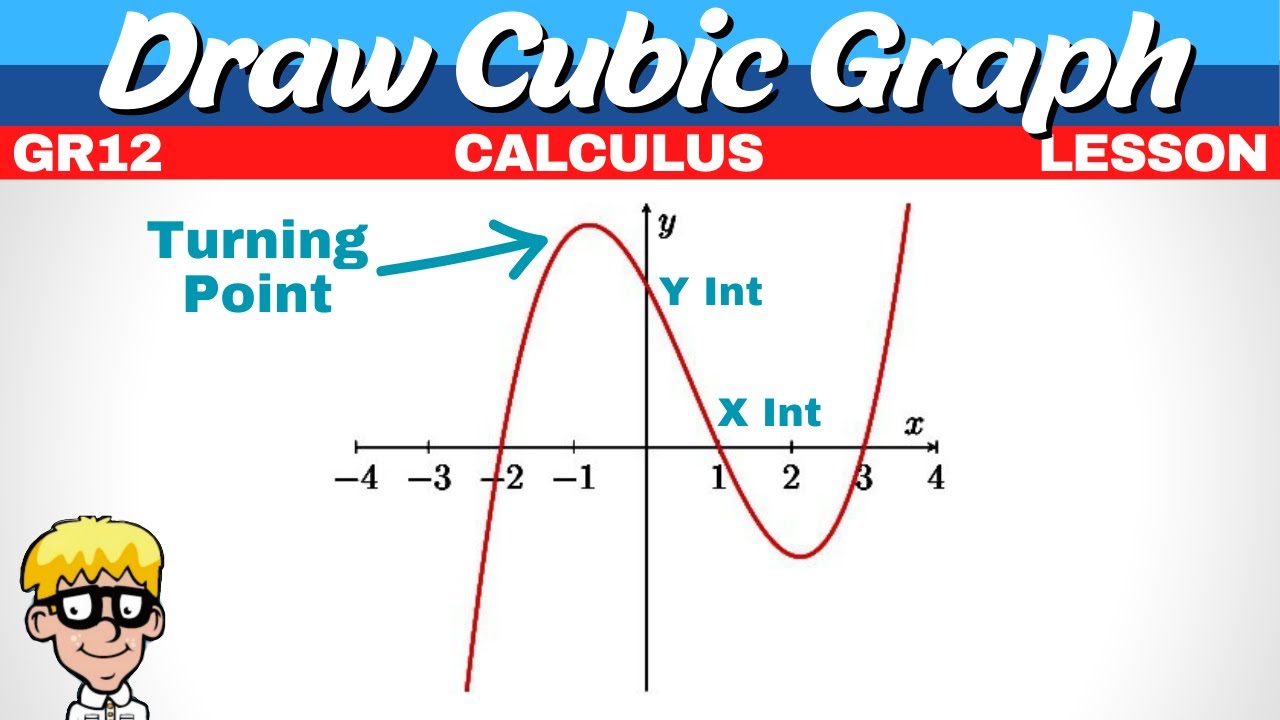
The script begins with an introduction to graph analysis, focusing on a sketched graph of a function 'f of x'. It addresses potential confusion with the placement of 'a' in the equation and emphasizes the importance of recognizing when an x-intercept is also a turning point, which counts as two x-intercepts. The speaker provides a method for determining the equation of 'f' using x-intercepts and introduces the task of sketching the graph on individual pages for clarity.
🔍 Deriving the Equation of 'f'
This paragraph delves into the process of deriving the equation of the function 'f' from its x-intercepts and turning points. The method involves creating brackets around the x-intercepts and the y-intercept, then substituting the x-value of the turning point to find the unknown 'a'. The speaker clarifies that when a turning point coincides with an x-intercept, it should be counted twice. The x-value of 'M' is determined to be -1, and the equation is simplified accordingly.
📉 Analyzing the Graph's Behavior
The script continues with an analysis of the graph's behavior, including identifying the coordinates of the turning point 'N' by setting the first derivative to zero and solving for 'x'. It also discusses when the function 'f(x)' is less than zero, explaining the concept of intervals and how to express them in notation. The increasing nature of the graph is explored, identifying intervals where the gradient is positive.
📈 Determining Concavity and Maximum Distance
The paragraph discusses how to determine where the graph is concave up by finding the second derivative and setting it to zero to locate the inflection point. It also addresses how to find the maximum vertical distance between the graph of 'f' and its first derivative over a given interval. The method involves taking the first derivative of the vertical distance formula and solving for 'x' to find the point of maximum distance.
📝 Calculating the Maximum Vertical Distance
This final paragraph focuses on calculating the exact maximum vertical distance between the two graphs. The process involves taking the first derivative of the vertical distance equation, setting it to zero, and solving for 'x' within the specified domain. The x-value that maximizes the distance is found, and the maximum distance is calculated by substituting this x-value back into the vertical distance formula, yielding a result rounded to two decimal places.
Mindmap
Keywords
💡x-intercept
💡turning point
💡y-intercept
💡gradient
💡first derivative
💡second derivative
💡concave up
💡concave down
💡inflection point
💡interval notation
💡maximum vertical distance
Highlights
The transcript discusses the process of determining the equation of a function given its x-intercepts and turning points.
Clarification is provided on the importance of recognizing when an x-intercept is also a turning point, which counts as two x-intercepts.
The method for constructing the equation of a function using brackets for x-intercepts is explained, including handling negative values.
A step-by-step guide is given for finding the x-value of a turning point when it is also an x-intercept.
The transcript explains the process of multiplying brackets to find the equation of a function, emphasizing the importance of keeping terms in brackets.
The calculation of the coordinates of a turning point 'N' is demonstrated using the first derivative set to zero.
The concept of concavity and how to determine where a graph is concave up or down using the second derivative is introduced.
A method for finding the inflection point of a graph by setting the second derivative to zero is outlined.
The transcript explains how to determine where a graph is increasing or decreasing by analyzing the gradient.
The process of finding the maximum vertical distance between a graph and its first derivative within a given interval is detailed.
A technique for comparing two graphs to find the maximum distance by subtracting the lower graph's equation from the top graph's equation is presented.
The use of the first derivative to find maximums and minimums by setting it equal to zero is demonstrated.
The transcript provides a practical example of finding the maximum vertical distance using the derived equation and plugging in the x-value.
The importance of understanding the domain when solving quadratic equations to find x-values is highlighted.
The transcript emphasizes the need to interpret the results of derivative calculations correctly, especially when identifying turning points and inflection points.
A comprehensive explanation of the relationship between the first and second derivatives and the concavity of a graph is provided.
The transcript concludes with a summary of the maximum vertical distance calculation, reinforcing the importance of methodical mathematical processes.
Transcripts


5.0 / 5 (0 votes)
Thanks for rating: