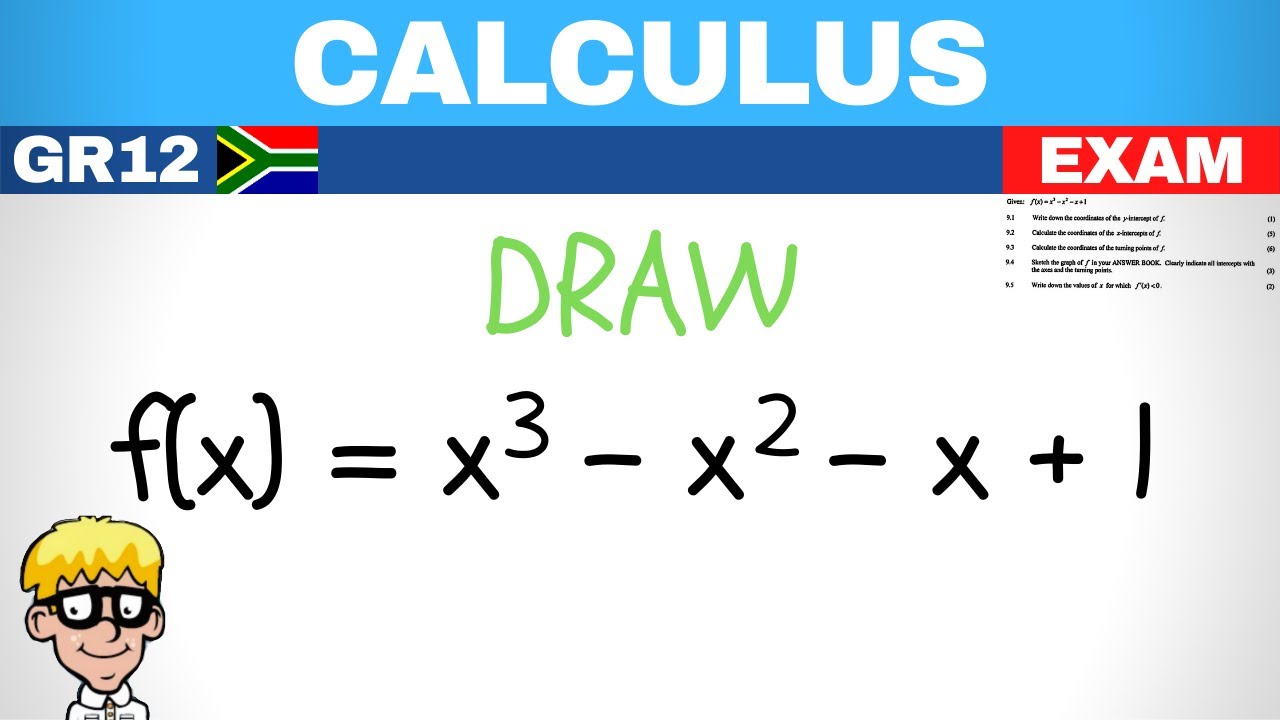
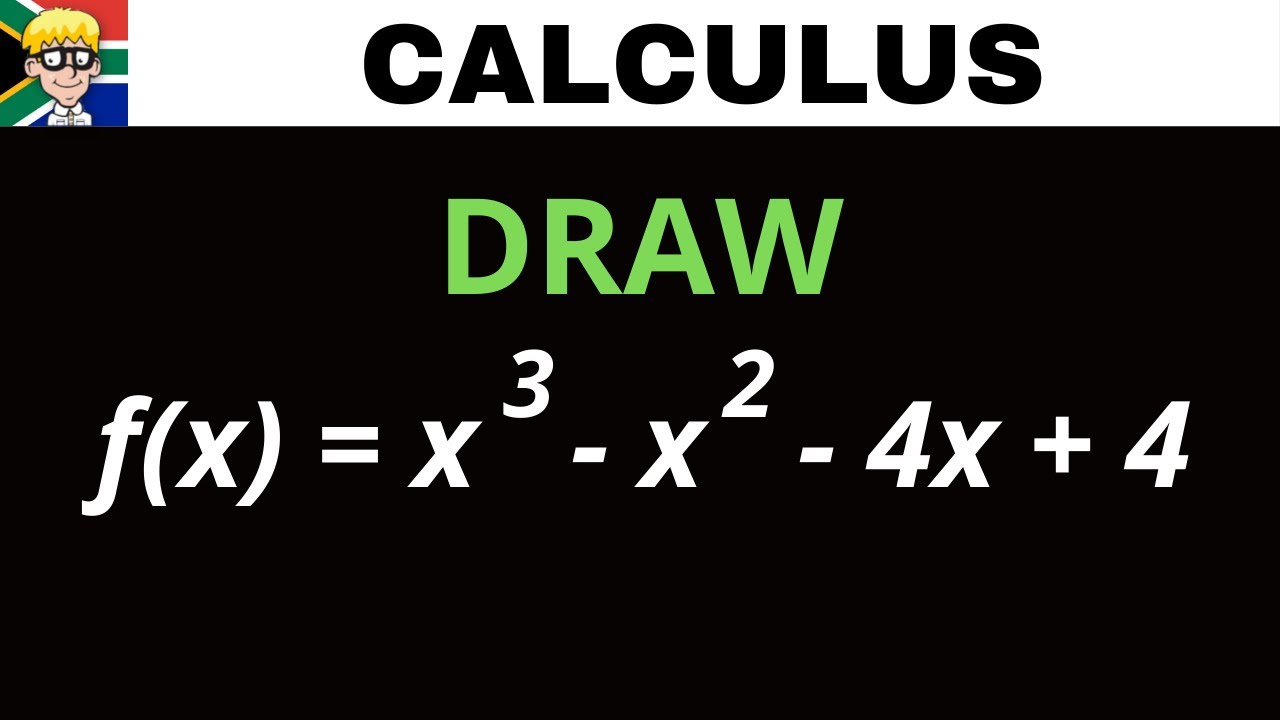
Draw Cubic Graph Grade 12
TLDRThis lesson focuses on the process of drawing cubic graphs, which typically have three x-intercepts and two turning points. The instructor explains how to find y-intercepts by setting x to zero, turning points by finding where the gradient (first derivative) is zero, and the point of inflection where the second derivative equals zero. The most challenging aspect is determining the x-intercepts, which involves guessing a value, plugging in different x-values, and simplifying the cubic equation into a trinomial form to find the remaining intercepts. The method involves factoring and using the quadratic formula if necessary. The instructor emphasizes that the goal is to find three x-intercepts, which, along with the inflection point, turning points, and y-intercept, will allow students to complete the graph. The video also mentions a course on the factor and remainder theorem for further assistance with this process.
Takeaways
- 📚 A cubic graph typically turns twice and has three x-intercepts, although variations can occur.
- 📈 To draw a cubic graph, you need to identify x-intercepts, y-intercept, turning points, and the inflection point.
- 🔍 The y-intercept is found by setting x equal to zero in the equation.
- 📉 Turning points, where the gradient is zero, are found by taking the first derivative of the equation and setting it to zero.
- 🔧 The inflection point, where concavity changes, is located by finding where the second derivative equals zero.
- 🔢 Finding x-intercepts involves setting y to zero and solving for x, which can be complex in higher grade levels.
- 🎯 The most challenging part of drawing cubic graphs is determining the x-intercepts, which may require guessing and checking different x values.
- 📝 For advanced methods to find x-intercepts, the instructor suggests a course on the factor and remainder theorem.
- 📉 After finding an x-intercept, the method involves factorizing the cubic equation into a trinomial to find the remaining x-intercepts.
- 🔑 The value 'a' in the trinomial is determined by the coefficient of x³, which should be 1 when factorized.
- 🔍 The constant 'c' and coefficient 'b' of the trinomial are found using the known x-intercept and the original cubic equation's constant term.
- 📊 Once the x-intercepts are determined, the cubic graph can be drawn with the help of the inflection point, turning points, and y-intercept.
Q & A
What is a cubic graph?
-A cubic graph is a mathematical representation that typically turns twice and has three x-intercepts, although the number of intercepts can vary.
What are the basic elements to consider when drawing a cubic graph?
-The basic elements include x-intercepts, a y-intercept, turning points (denoted as TP), and the inflection point, which is where the graph switches from concave down to concave up or vice versa.
How do you find the y-intercept of a cubic graph?
-To find the y-intercept, you set x equal to zero and solve for y.
What are turning points on a graph?
-Turning points are the points on the graph where the gradient, or the first derivative of the function, is zero.
How do you find the inflection point of a cubic graph?
-The inflection point is found where the second derivative of the function is equal to zero.
What is the process for finding x-intercepts of a cubic graph?
-To find x-intercepts, you set y equal to zero and solve for x. This often involves guessing a value for x and plugging it into the equation until you find a value that results in zero.
Why is finding x-intercepts considered the most challenging part of drawing cubic graphs?
-Finding x-intercepts is challenging because it requires guessing a value for x and then using trial and error to find the correct x-values that result in zero.
What is the method for finding the first x-intercept?
-The method involves guessing a value for x, plugging it into the equation, and using a calculator to check if the result is zero. If not, different values are tried until a zero result is obtained.
How do you determine the coefficients a, b, and c after finding the first x-intercept?
-After finding the first x-intercept, you assume the cubic equation can be factored into (x - x-intercept) times a trinomial (ax^2 + bx + c). You then use the known values to solve for a, b, and c.
What is the final step after determining the coefficients a, b, and c?
-The final step is to factorize the trinomial as far as possible to find the remaining x-intercepts, which can then be used to draw the cubic graph along with the inflection point, turning points, and y-intercept.
Why is it important to find all three x-intercepts when drawing a cubic graph?
-Finding all three x-intercepts is important because they provide key points on the graph that help in accurately drawing the shape and behavior of the cubic function.
Outlines
📚 Introduction to Drawing Cubic Graphs
This paragraph introduces the concept of drawing cubic graphs, which typically have three x-intercepts and may turn twice. The speaker outlines the basic elements needed to draw such a graph, including x-intercepts, a y-intercept, turning points (referred to as 'tp'), and an inflection point. The inflection point is where the graph switches from concave down to concave up or vice versa. The paragraph emphasizes the process of finding these elements, particularly the x-intercepts, which is the most challenging part. It also mentions a course on the factor and remainder theorem that can help with finding x-intercepts and touches on the method of finding y-intercepts and turning points through derivatives.
🔍 Detailed Method for Finding X-Intercepts of Cubic Graphs
In this paragraph, the speaker delves into the detailed method of finding x-intercepts for cubic graphs, which is a critical and challenging aspect of graph drawing. The process involves setting y to zero and guessing values for x until an equation results in zero. The speaker illustrates this with an example, starting with x = -1 and then trying x = 1, which yields the first x-intercept. The method then involves factorizing the cubic equation after finding one x-intercept, resulting in a trinomial that can be further factorized or solved using the quadratic formula. The goal is to find three x-intercepts, which are then used to plot the graph along with the inflection point, turning points, and y-intercept. The paragraph concludes with a note that further practice will be provided in upcoming videos.
Mindmap
Keywords
💡Cubic Graph
💡X-Intercepts
💡Y-Intercept
💡Turning Points
💡Inflection Point
💡First Derivative
💡Second Derivative
💡Factor and Remainder Theorem
💡Bracket Form
💡Quadratic Formula
💡Factorization
Highlights
Lesson focuses on how to draw cubic graphs.
A cubic graph typically turns twice and has three x-intercepts.
Basic elements of a cubic graph include x-intercepts, y-intercept, turning points, and inflection point.
Finding y-intercepts involves setting x equal to zero.
Turning points are located where the gradient is zero, found using the first derivative.
Inflection point is where the second derivative equals zero.
Finding x-intercepts involves setting y to zero and guessing values for x.
A method for finding three x-intercepts is introduced, which can be challenging.
The process of finding x-intercepts involves guessing and using a calculator to test values.
Once an x-intercept is found, it is represented in bracket form, indicating the factor of the cubic equation.
The method involves dividing the cubic expression by the found factor to simplify it to a trinomial.
Values for a, b, and c in the trinomial are determined by multiplying the known factors.
The goal is to simplify the cubic equation to find all three x-intercepts.
The process includes factorizing the simplified trinomial to find the remaining x-intercepts.
If the trinomial cannot be factorised, the quadratic formula is used to find the remaining x-intercepts.
The final step is to plot the x-intercepts, inflection point, turning points, and y-intercept to draw the cubic graph.
Upcoming videos will provide examples and practice for drawing cubic graphs.
Transcripts


5.0 / 5 (0 votes)
Thanks for rating: