How to Do a T-Test for Beginners
TLDRMr. McGee's video script introduces the Student's t-test, a fundamental statistical tool for assessing significant differences between two data sets. Originating from William Sealy Gosset's work at Guinness, the t-test helps eliminate bias and provides a p-value to determine if differences are significant or random. The script explains the importance of distinguishing between one-tailed and two-tailed tests, and between paired and unpaired data, using practical examples like class grades and grasshopper weights. It emphasizes the need for a p-value less than 0.05 for scientific significance, guiding viewers through the process of conducting a t-test in Excel.
Takeaways
- 📚 The t-test, invented by William Sealy Gosset in 1908, is a fundamental statistical test used to determine if there is a significant difference between two sets of data.
- 🔍 The purpose of a t-test is to eliminate bias in scientific conclusions by providing a mathematical measure of the significance of the difference between data sets.
- 📈 A t-test assesses the probability that the observed difference between two groups is due to random chance, rather than a true effect, using a p-value.
- 🎯 A p-value less than 0.05 (5%) indicates that there is less than a 5% chance that the data is random, suggesting a significant difference between the groups.
- 📉 Conversely, a p-value greater than 0.05 suggests a higher likelihood that the observed differences are due to random chance, indicating no significant difference.
- 📊 The t-test considers both the mean and the standard deviation of the data, providing a more comprehensive analysis than simply comparing means.
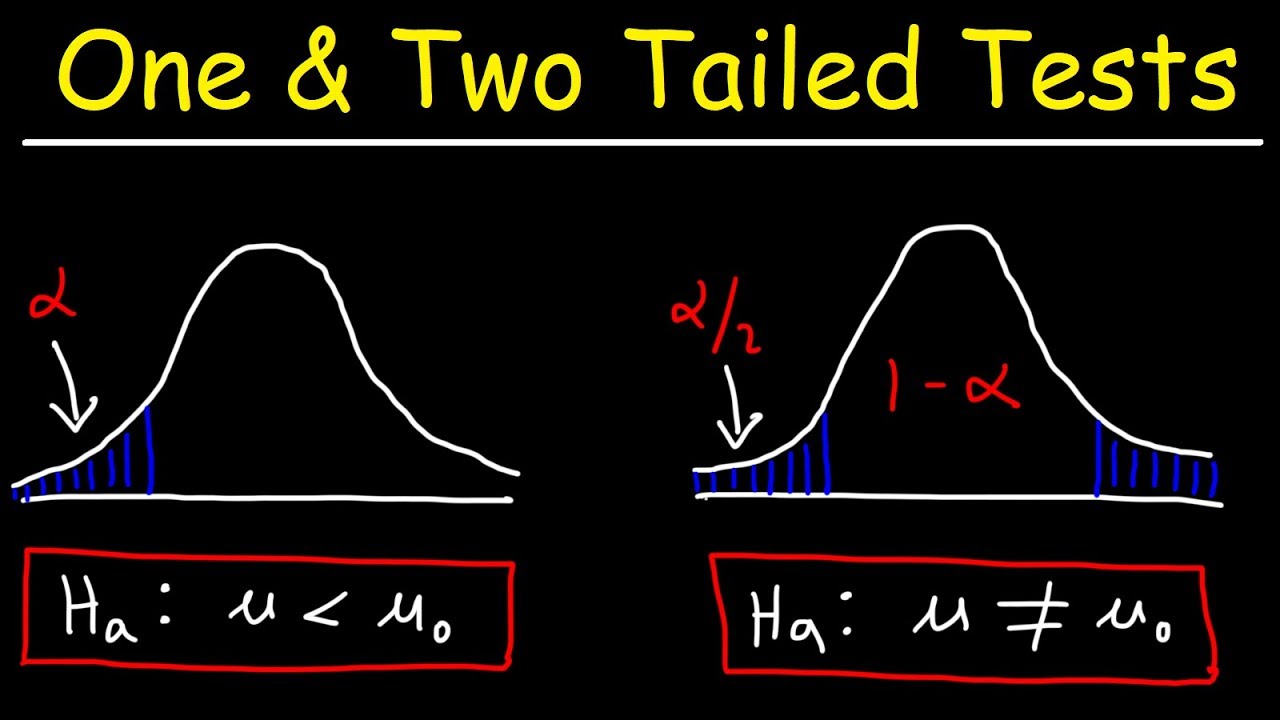
- 🤔 Before conducting a t-test, it's important to determine if the test is one-tailed or two-tailed, and whether the data is paired or unpaired.
- 🔄 A one-tailed t-test is used when the hypothesis is directional (e.g., one group is expected to be larger), while a two-tailed test is used for non-directional hypotheses.
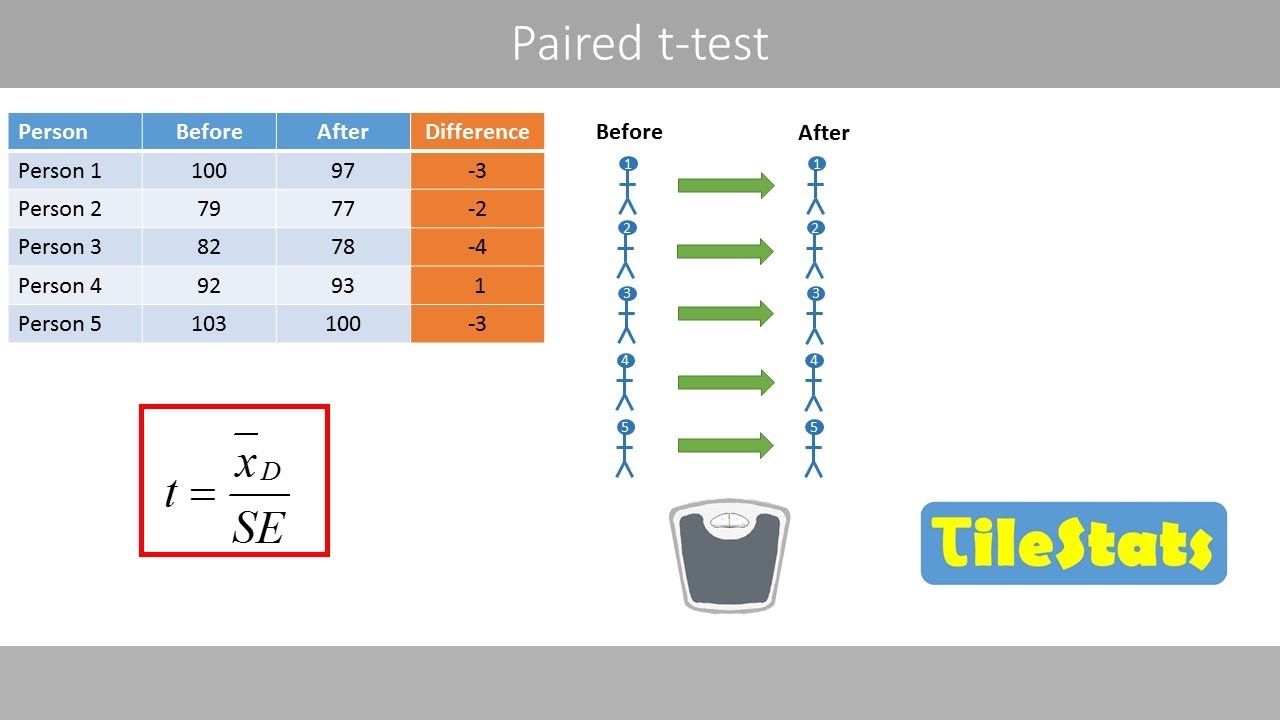
- 🔗 Paired data refers to measurements taken from the same entities at different times or conditions, whereas unpaired data involves separate, unrelated groups.
- 📝 The t-test requires a minimum of 10 samples to be statistically valid, ensuring the formation of a bell curve for accurate analysis.
- 📊 Understanding the concept of a bell curve and standard deviation is crucial for interpreting the results of a t-test and determining outliers.
- 📋 The script provides practical examples of t-tests, including analyzing test scores before and after a course, and comparing the mass of male and female grasshoppers.
Q & A
What is the purpose of a t-test?
-The purpose of a t-test is to determine if there is a significant difference between two sets of data, thereby eliminating bias and providing an objective measure of the data's significance.
Who invented the t-test and why?
-William Sealy Gosset invented the t-test in 1908 while working for the Guinness Company in Ireland. He created it to test different varieties of barley and determine if there were significant differences in their experiments, using the pen name 'Student' to publish his work.
What is a p-value in the context of a t-test?
-A p-value is the probability that the observed difference in data is due to random chance rather than a true effect. It helps determine the significance of the results, with a common threshold for significance being a p-value less than 0.05.
What does a p-value less than 0.05 indicate in a t-test?
-A p-value less than 0.05 indicates that there is less than a 5% chance that the observed differences in data are due to random chance, suggesting that the data is significantly different with a high level of confidence (greater than 95%).
What is the difference between a one-tailed and a two-tailed t-test?
-A one-tailed t-test is used when the hypothesis is directional, expecting the difference in one specific direction. A two-tailed t-test is used for non-directional hypotheses, allowing for significant differences in either direction.
What is meant by paired and unpaired data in the context of a t-test?
-Paired data refers to two sets of measurements that are related or matched, such as measurements taken from the same subjects at different times. Unpaired data refers to measurements that are independent and not matched, such as measurements from different subjects.
Why is it important to determine if a t-test should be one-tailed or two-tailed?
-Determining whether a t-test should be one-tailed or two-tailed is important because it affects the directionality of the hypothesis being tested and the interpretation of the p-value, which in turn influences the conclusion about the significance of the results.
What is the minimum sample size required to conduct a t-test?
-A minimum of 10 samples is typically required for each group being compared in a t-test to ensure the validity and accuracy of the results.
How does the t-test help in eliminating bias in scientific conclusions?
-The t-test provides a mathematical measure of the significance of differences between data sets, allowing researchers to make objective conclusions based on statistical evidence rather than subjective interpretation of the data.
Can you provide an example of how a t-test might be used in a classroom setting?
-In a classroom setting, a t-test might be used to compare the average test scores of two different classes or to assess the improvement in students' scores from a pretest to a post-test, helping to determine if the differences are statistically significant.
Outlines
🔬 Introduction to Student's T-Test
This paragraph introduces the concept of the Student's T-Test, a fundamental statistical method in scientific research, which was first developed by William Sealy Gosset in 1908 for testing differences in barley varieties at Guinness Company. The purpose of the t-test is to determine if there is a significant difference between two sets of data, thus eliminating bias and providing an objective measure. The paragraph explains that the t-test provides a p-value, which is a probability that the observed difference is not due to random chance. A commonly accepted threshold for significance is a p-value less than 0.05, indicating a less than 5% chance that the results are random and more than 95% confidence in the significance of the data.
📊 Understanding T-Test Parameters and Bell Curve
The second paragraph delves into the importance of understanding the bell curve and standard deviation in the context of the t-test. It explains that the bell curve represents a normal distribution of data, with the mean at the peak and outliers at the extremes. The standard deviation is the measure of how spread out the data is from the mean. The paragraph also discusses the concept of outliers and how they can affect the interpretation of data. It introduces the idea of one-tailed versus two-tailed t-tests, which depend on the nature of the hypothesis being tested, and the distinction between paired and unpaired data, which is crucial for selecting the appropriate t-test.
📚 Examples of Conducting T-Tests in Excel
This paragraph provides practical examples of how to conduct t-tests using Microsoft Excel. It illustrates the process with a pretest and post-test scenario, demonstrating how to input data, select the type of t-test (one-tailed or two-tailed, paired or unpaired), and interpret the resulting p-value. The example shows a significant improvement in test scores from the beginning to the end of the year, with an extremely low p-value indicating a high level of confidence in the significance of the results. The paragraph emphasizes the importance of proper data arrangement and the selection of the correct t-test type to ensure accurate results.
📉 Analyzing Significance in T-Test Results
The final paragraph discusses the interpretation of t-test results, focusing on the significance of p-values in determining whether observed differences are statistically significant. It provides examples involving the mass of male and female grasshoppers, as well as final grades from two different classes, to illustrate how the t-test can be applied to various scenarios. The paragraph clarifies that a p-value greater than 0.05 suggests a higher likelihood of random occurrence and does not meet the scientific standard for significance. It concludes by emphasizing the importance of understanding the principles of t-testing and accurately citing p-values when drawing conclusions from data.
Mindmap
Keywords
💡Student's t-test
💡Significance
💡P-value
💡Mean
💡Standard deviation
💡Bell curve
💡Outliers
💡One-tailed vs. Two-tailed t-test
💡Paired vs. Unpaired data
💡Null hypothesis
💡Confidence interval
Highlights
Introduction to Student's t-test, a fundamental statistical test in science.
Historical background of the t-test, invented by William Sealy Gosset in 1908 for testing barley varieties at Guinness Company.
The t-test's purpose is to identify significant differences between two sets of data, eliminating bias in conclusions.
Explanation of how the t-test helps in being objective in scientific analysis by providing a mathematical measure of significance.
Clarification on the importance of p-value in t-test, with a critical value of less than 0.05 indicating significant data.
Example of using t-test to determine if a difference in class averages is significant, beyond just looking at the mean.
Differentiation between one-tailed and two-tailed t-tests based on the openness of the hypothesis or question.
Discussion on paired and unpaired data in the context of t-test, with examples of each.
Demonstration of conducting a t-test in Excel, including selecting data arrays and choosing test types.
Interpretation of p-values in the context of scientific studies, aiming for a 95% confidence interval.
Use of bell curve and standard deviation in understanding data distribution and identifying outliers.
Application of t-test in an educational setting to compare pretest and post-test scores.
Example of using t-test to analyze the mass difference between male and female grasshoppers.
Importance of having a minimum of 10 samples for a valid t-test and the impact of sample size on accuracy.
Comparison of final grades between two classes using t-test to determine if there is a significant difference.
Final thoughts on the simplicity and importance of t-test in scientific analysis and the need for proper calculation and citation of p-values.
Transcripts
Browse More Related Video


5.0 / 5 (0 votes)
Thanks for rating: