The paired t-test | explained with a simple example
TLDRThis lecture introduces the paired t-test, also known as the dependent sample t-test, which is used to determine if the mean difference between pairs of observations is significantly different from zero. The video explains the difference between paired and unpaired study designs through examples, such as testing the effect of a new drug on blood pressure. It emphasizes the advantage of paired designs in reducing variability by comparing similar individuals. The calculation of the paired t-test is demonstrated using an example of weight loss after a diet, including the computation of the t-statistic, p-value, and a 95% confidence interval. The assumption of normal distribution for the differences is highlighted, and the non-parametric alternative is suggested if this assumption is not met. The video concludes by differentiating the paired t-test from the one-sample t-test, noting that the former is based on differences between pairs, while the latter can involve any continuous variable's mean.
Takeaways
- 📚 A paired t-test, also known as a dependent sample t-test, is used to determine if the mean difference between pairs of observations is different from zero.
- 🧬 The choice between a paired and unpaired t-test depends on the study design, with paired tests used when the same subjects are measured twice or when subjects are matched.
- 💡 Paired t-tests are advantageous because they reduce variability by comparing differences between similar individuals or the same individuals over time.
- ⚖️ The null hypothesis for a paired t-test states that the population mean difference is equal to zero, while the alternative hypothesis suggests it is not.
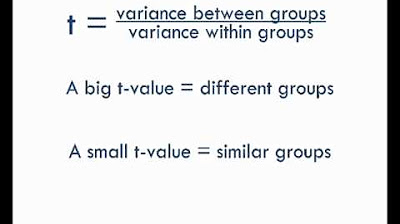
- 📉 The t-statistic for a paired t-test is calculated by dividing the mean of the differences by the standard error of that mean.
- 📊 The standard error is found by dividing the standard deviation of the differences by the square root of the sample size.
- 🔢 A significance level (e.g., 0.05) is used to determine if the observed differences are statistically significant enough to reject the null hypothesis.
- 📋 A confidence interval, such as a 95% confidence interval, provides a range within which we can be confident the true population mean difference lies.
- ⚠️ An assumption of the paired t-test is that the differences between the paired observations should be normally distributed, especially with small sample sizes.
- 🌐 If the differences are not normally distributed, a non-parametric test might be more appropriate.
- 🔄 The one-sample t-test and the paired t-test are similar in their equations, but the one-sample t-test is not restricted to differences between pairs and can involve the mean of any continuous variable.
- 🎓 Understanding the assumptions and the implications of the study design is crucial for choosing the correct statistical test and interpreting the results accurately.
Q & A
What is the primary purpose of a paired t-test?
-A paired t-test, also known as a dependent sample t-test, is used to determine if the mean difference from pairs of observations is different from zero. It is particularly useful for comparing two sets of measurements taken from the same individuals or matched pairs.
What is the difference between a paired and an unpaired study design?
-A paired study design involves comparing two sets of measurements from the same subjects, such as before and after a treatment, or matched pairs. An unpaired study design, on the other hand, involves comparing measurements from two different groups of subjects, such as a treatment group and a control group.
Why would one choose a paired t-test over an unpaired t-test?
-A paired t-test is chosen when the study design involves repeated measurements on the same subjects or matched pairs to control for variability between individuals. This can reduce the influence of confounding factors and increase the sensitivity of the test to detect differences.
What is the null hypothesis in the context of a paired t-test?
-The null hypothesis in a paired t-test states that the population mean difference between the paired values is equal to zero. This implies that there is no effect or change attributed to the treatment or condition being tested.
How is the standard error of the mean of differences calculated in a paired t-test?
-The standard error of the mean of differences is calculated by dividing the standard deviation of the differences by the square root of the sample size (n).
What does the t-statistic represent in a paired t-test?
-The t-statistic in a paired t-test represents the mean of the differences divided by the standard error of that mean. It is used to determine whether the observed differences are statistically significant.
What is the significance level used in the example provided in the script?
-In the example provided, the significance level used is 0.05, which is a common threshold for determining statistical significance.
Why might a study fail to reject the null hypothesis despite an observed mean difference?
-A study might fail to reject the null hypothesis if the sample size is too small, leading to a larger standard error and a less significant t-statistic. A larger sample size would typically result in a smaller standard error and a more pronounced t-statistic, potentially leading to a significant result.
What is the role of the confidence interval in the context of a paired t-test?
-The confidence interval provides a range within which we can be confident that the true population mean difference lies. If the confidence interval includes zero, it suggests that there is not enough evidence to reject the null hypothesis.
What is the main assumption of the paired t-test?
-The main assumption of the paired t-test is that the differences between the pairs of observations should be normally distributed. This is particularly important when the sample size is small, as the central limit theorem does not apply.
How does a paired t-test relate to a one-sample t-test?
-A paired t-test is a specific application of a one-sample t-test that focuses on the differences between paired observations. The one-sample t-test, however, can be used for a broader range of scenarios and is not limited to just differences between pairs.
Outlines
🧪 Introduction to Paired t-Test and Study Designs
This paragraph introduces the concept of the paired t-test, also known as the dependent sample t-test, which is used to determine if the mean difference between pairs of observations differs significantly from zero. The paragraph explains the distinction between paired and unpaired study designs through the example of a hypothetical drug trial to reduce systolic blood pressure. It outlines two scenarios: one where individuals are assigned to treatment and control groups, and another where individuals are paired based on similar characteristics before being assigned to treatment or control. The paragraph also discusses before-and-after studies and the analysis of treated versus untreated samples from the same individual, both of which are suitable for paired t-tests. The main takeaway is understanding when to apply a paired t-test based on study design.
📊 Calculation and Interpretation of Paired t-Test
This paragraph delves into the calculation of the paired t-test using a dataset that tracks weight changes before and after a diet intervention. It explains how to compute the mean and standard deviation of the differences in weight, leading to the formulation of a t-statistic. The null hypothesis is that the mean difference is zero, suggesting no effect from the diet, while the alternative hypothesis posits a non-zero mean difference. The t-statistic is calculated, and a p-value is determined using a t-distribution with the appropriate degrees of freedom. The paragraph also discusses the implications of a p-value in relation to the significance level and how it leads to the acceptance or rejection of the null hypothesis. Additionally, it covers the computation of a 95% confidence interval for the mean difference, which in this case includes zero, indicating insufficient evidence to reject the null hypothesis and conclude a significant weight loss effect from the diet.
📚 Assumptions and Comparison with One-Sample t-Test
The final paragraph addresses the assumptions underlying the paired t-test, emphasizing the importance of normal distribution of differences for small sample sizes and suggesting non-parametric tests as alternatives when normality is not met. It also clarifies the relationship between the paired t-test and the one-sample t-test, highlighting that the paired t-test is essentially a one-sample t-test applied to differences between paired observations. The paragraph concludes by reinforcing the understanding of when to use a paired t-test and wraps up the educational content on this statistical method.
Mindmap
Keywords
💡Paired t-test
💡Confidence Interval
💡Assumptions
💡Study Design
💡Unpaired t-test
💡Mean Difference
💡Null Hypothesis
💡Significance Level
💡Standard Error
💡One-Sample t-Test
Highlights
Introduction to the paired t-test and its comparison to the unpaired t-test.
Explanation of when to use a paired t-test: to determine if the mean difference from pairs of observations is different from zero.
Study designs for understanding the difference between paired and unpaired study designs.
The importance of controlling external factors in study designs.
Example of a study design involving a new drug to reduce systolic blood pressure.
Use of an unpaired t-test when individuals are assigned to treatment and control groups.
Advantages of pairing individuals based on similar characteristics in a study design.
Appropriateness of a paired t-test for observing differences between similar individuals.
Description of a before and after study design for analyzing the effect of a drug.
Use of paired measurements in the same individuals for a paired t-test.
Example of analyzing the effect of treated and untreated samples from the same individual.
Advantage of reducing variability between individuals in paired study designs.
Calculation process of a paired t-test using example data on weights before and after a diet.
Explanation of the null hypothesis and alternative hypothesis in a paired t-test.
Use of a paired t-test to determine if observed weight loss is not due to chance.
Calculation of the t-statistic and its significance in paired t-test.
Interpretation of the p-value and its relation to the significance level in hypothesis testing.
Conclusion on the effect of a diet on body weight based on the paired t-test results.
Calculation and interpretation of the 95% confidence interval for the mean difference.
Assumptions of the paired t-test regarding the normal distribution of differences.
Difference between a paired t-test and a one-sample t-test in terms of their application.
Transcripts
Browse More Related Video


5.0 / 5 (0 votes)
Thanks for rating: