One sample t-test vs Independent t-test vs Paired t-test
TLDRThis script explains three types of t-tests: one sample, independent samples, and paired samples t-tests. It details when to use each test, such as comparing a sample mean to a known reference mean or assessing differences between two groups. The script outlines the assumptions for t-tests, including the need for metric variables with normal distribution and equal variances in independent samples. It also covers the hypotheses for each test and the process of calculating the T value, emphasizing the impact of mean differences and data dispersion on the T value's significance.
Takeaways
- 📊 There are three types of t-tests: one sample t-test, independent samples t-test, and paired samples t-test.
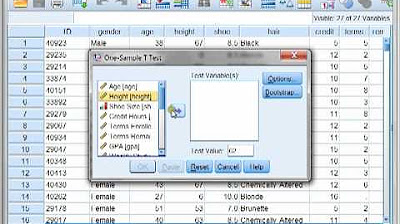
- 🍫 The one sample t-test is used to compare the mean of a sample to a known reference mean, such as verifying a chocolate bar's weight claim.
- 🧑🤝🧑 The independent samples t-test compares the means of two independent groups to check for significant differences, like comparing the effectiveness of two painkillers.
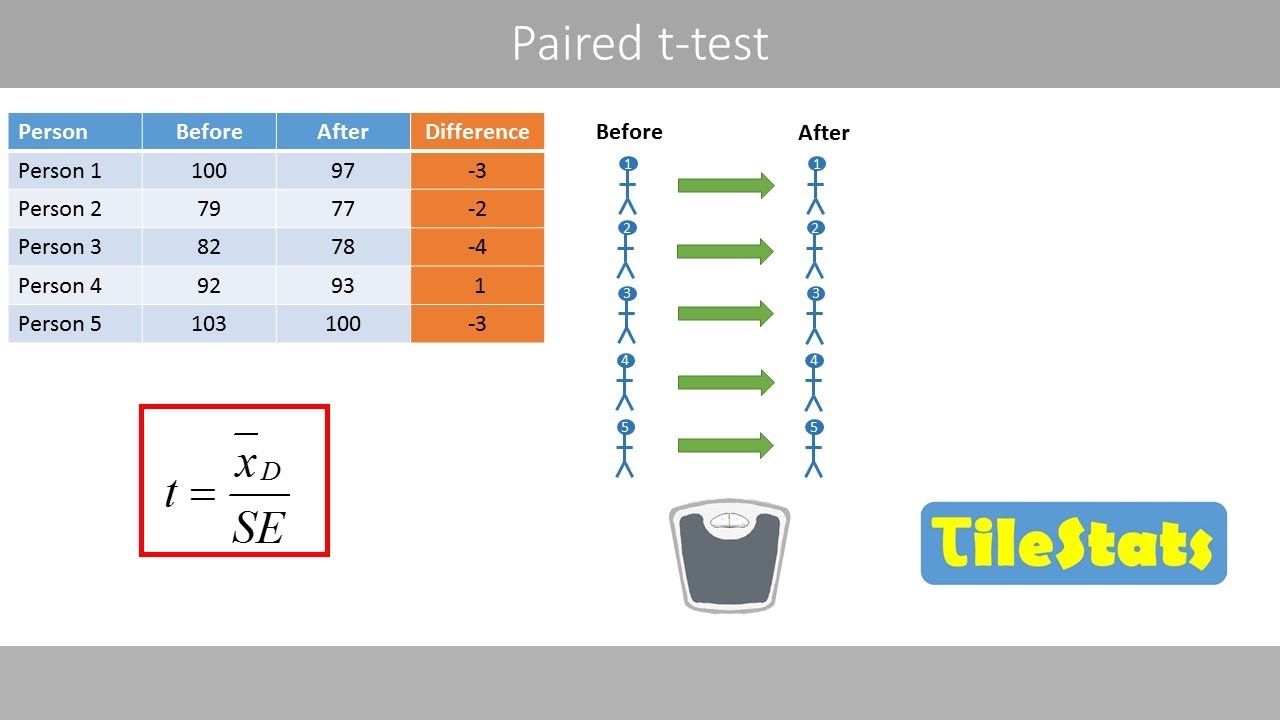
- 🔄 The paired samples t-test is used to compare the means of two dependent groups, such as the weight difference before and after a diet for the same individuals.
- 🔍 The paired samples t-test can be thought of as a one sample t-test with repeated measurements from the same subjects.
- 📐 The assumptions for a t-test include having a suitable sample, metric variables, normal distribution of the metric variable, and equal variances in the case of an independent t-test.
- ⚖️ Levine's test can be used to check if the variances in two groups are approximately equal for the independent t-test.
- 💡 The hypotheses for t-tests include a null hypothesis stating no difference and an alternative hypothesis stating a significant difference between means.
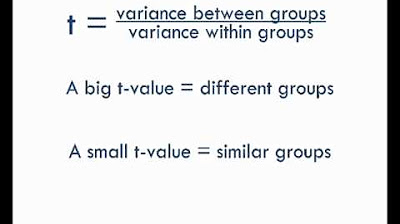
- 📐 Calculating a t-test involves determining the T value, which requires the difference between means and the standard error.
- 📉 The T value increases with a greater difference between means and decreases with more data dispersion, indicating a less meaningful mean difference.
- 📚 Detailed formulas for calculating the standard error in t-tests can be found on datadeep.net, depending on whether equal or unequal variances are assumed.
Q & A
What are the three types of t-tests mentioned in the script?
-The three types of t-tests are the one sample t-test, the independent samples t-test, and the paired samples t-test.
When should a one sample t-test be used?
-A one sample t-test is used to compare the mean of a sample with a known reference mean, such as when testing a manufacturer's claim about the average weight of a product.
Can you provide an example of when to use an independent samples t-test?
-An independent samples t-test is used when comparing the means of two independent groups or samples to determine if there is a significant difference between them, like comparing the effectiveness of two different painkillers in two randomly divided groups.
What is the purpose of a paired samples t-test?
-A paired samples t-test is used to compare the means of two dependent groups, such as before and after measurements on the same subjects, to determine if there is a significant difference, like assessing the effectiveness of a diet on weight loss.
How are paired samples different from independent samples?
-Paired samples are measurements that are dependent on each other, often resulting from repeated measurements on the same subjects, whereas independent samples consist of separate individuals or measurements that are not dependent on each other.
What assumptions are necessary for conducting a t-test?
-Assumptions for a t-test include having a suitable sample, the variable of interest being metric and normally distributed, and in the case of an independent t-test, the variances in the two groups being approximately equal.
How can you check if the variances in two groups are approximately equal for an independent t-test?
-You can check if the variances are equal using Levine's test, which provides more information on the equality of variances between the two groups.
What are the null and alternative hypotheses for a one sample t-test?
-In a one sample t-test, the null hypothesis is that the sample mean is equal to the given reference value, indicating no difference. The alternative hypothesis is that the sample mean is not equal to the reference value, suggesting a significant difference.
How is the T value calculated in a t-test?
-The T value is calculated by determining the difference between the means and the standard error of the mean. The standard error is the standard deviation of the data divided by the square root of the number of cases (N).
What does the T value indicate in the context of a t-test?
-The T value indicates the magnitude of the difference between the means relative to the standard error. A larger T value suggests a greater difference between the means, while a smaller T value indicates a smaller difference or greater dispersion in the data.
How can you interpret the results of a t-test?
-The results of a t-test are interpreted by comparing the calculated T value with a critical value from the t-distribution. If the T value is greater than the critical value, it suggests that there is a significant difference between the means, supporting the alternative hypothesis.
Outlines
📊 Understanding T-Tests for Different Scenarios
This paragraph introduces three types of t-tests: one sample, independent samples, and paired samples. It explains when to use each test, providing examples such as a chocolate bar manufacturer's claim about weight, comparing the effectiveness of two painkillers, and measuring the effectiveness of a diet. The paragraph also discusses the assumptions for a t-test, including the need for metric variables that are normally distributed and, in the case of the independent samples t-test, equal variances. It touches on the concept of hypotheses in t-tests, distinguishing between null and alternative hypotheses for each type of t-test.
📐 Calculating the T-Value for T-Tests
This paragraph delves into the process of calculating the T-value for t-tests. It outlines the steps for determining the T-value, which involves finding the difference between the means and the standard error. The explanation covers the specific calculations for one sample, independent samples, and paired samples t-tests, noting the use of standard deviation and the number of cases. It also mentions the impact of data dispersion on the T-value, indicating that a larger dispersion results in a smaller T-value, thus making a mean difference less significant. The paragraph concludes with a note of appreciation for the viewer's attention and an anticipation of future encounters.
Mindmap
Keywords
💡t-test
💡one sample t-test
💡independent samples t-test
💡paired samples t-test
💡null hypothesis
💡alternative hypothesis
💡metric variable
💡normal distribution
💡variance
💡standard error
💡T value
Highlights
Introduction to three types of t-tests: one sample, independent samples, and paired samples t-tests.
Explanation of when to use a one sample t-test to compare a sample mean with a known reference mean.
Example of a chocolate bar manufacturer's claim and the use of a one sample t-test to verify it.
Use case of the independent samples t-test for comparing means of two independent groups.
Illustration of comparing two painkillers' effectiveness using an independent t-test.
Description of the paired samples t-test for comparing means of two dependent groups.
Example of using a paired samples t-test to measure the effectiveness of a diet.
Clarification on the similarity between the paired samples t-test and the one sample t-test.
Assumptions necessary for conducting a t-test, including the need for metric variables and normal distribution.
Requirement of equal variances in the independent t-test and the use of Levine's test to check this.
Hypotheses of the t-test, including null and alternative hypotheses for one sample, independent, and paired samples t-tests.
Process of calculating the T value for a t-test, including the need for the difference between means and the standard error.
Different formulas for calculating the standard error depending on the assumption of equal or unequal variances.
Importance of the T value in reflecting the difference between means and the dispersion of data.
The impact of data dispersion on the T value, where more scattered data results in a less meaningful mean difference.
Conclusion and invitation to the next video in the series.
Transcripts


5.0 / 5 (0 votes)
Thanks for rating: