t-Test - Full Course - Everything you need to know
TLDRThis informative video script provides a comprehensive guide to the t-test, a statistical procedure used to analyze significant differences between the means of two groups. It explains the three types of t-tests: one sample, independent samples, and paired samples, detailing when each is appropriate. The script outlines the assumptions necessary for a t-test, such as the need for metric variables and normal distribution, and discusses the importance of equal variances in independent samples t-tests. It also covers how to formulate hypotheses for the test and introduces the concept of p-values and significance levels in determining whether to reject the null hypothesis. The explanation includes how to calculate t-values and use them to interpret results through critical T values or p-values. The script concludes with a brief mention of DataTap.net for further resources and the difference between one-tailed and two-tailed tests, emphasizing the practical application of t-tests in real-world scenarios.
Takeaways
- 📊 The t-test is a statistical test used to analyze if there is a significant difference between the means of two groups.
- 🔍 There are three types of t-tests: one sample t-test, independent samples t-test, and paired samples t-test, each used in different scenarios.
- ⚖️ A one sample t-test compares the mean of a sample to a known reference mean, like verifying a manufacturer's claim about the weight of a chocolate bar.
- ➕ An independent samples t-test is used to compare the means of two independent groups, such as the effectiveness of two different painkillers.
- 🔗 A paired samples t-test is used to compare the means of two dependent groups, like the weight of individuals before and after a diet.
- 📈 The assumptions for a t-test include having a suitable sample, the variable being tested must be metric and normally distributed, and for the independent t-test, variances between groups should be approximately equal.
- ❓ The hypotheses of the t-test include a null hypothesis stating no difference and an alternative hypothesis stating a difference exists between the means.
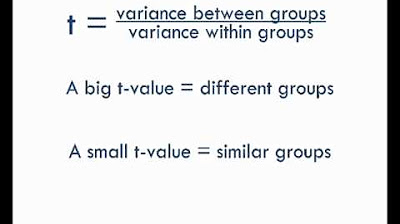
- 🧮 To calculate a t-test, you need to calculate the T value, which requires the difference between the means and the standard error.
- 📉 The T value increases with a greater difference between means and decreases with larger dispersion of the data.
- 🎯 The p-value indicates the likelihood of drawing a sample that deviates from the null hypothesis by the same amount or more, and it's used to decide whether to reject the null hypothesis.
- 📋 Rejection of the null hypothesis occurs if the calculated T value exceeds the critical T value from a table or if the p-value is less than the significance level, typically set at 5%.
- 🔑 The difference between a one-tailed and two-tailed t-test lies in the direction of the difference being considered; a two-tailed test considers both directions, while a one-tailed test focuses on one direction of difference.
Q & A
What is a t-test and what does it analyze?
-A t-test is a statistical test procedure used to analyze whether there is a significant difference between the means of two groups. It is commonly used to compare the means of two groups to determine if they are significantly different from each other.
What are the three types of t-tests?
-The three types of t-tests are the one sample t-test, the independent samples t-test, and the paired samples t-test. Each is used in different scenarios: one sample t-test compares a sample mean to a known reference mean, independent samples t-test compares the means of two independent groups, and paired samples t-test compares the means of two dependent groups.
When is a one sample t-test used?
-A one sample t-test is used when we want to compare the mean of a sample with a known reference mean. For example, if a manufacturer claims a certain average weight for their product, a one sample t-test can be used to verify this claim against a sample of the product.
How is the independent samples t-test different from the paired samples t-test?
-The independent samples t-test is used to compare the means of two independent groups, whereas the paired samples t-test is used to compare the means of two dependent groups. In the case of the paired samples t-test, the same subjects are measured twice under different conditions, and the differences between these measurements are analyzed.
What are the assumptions for conducting a t-test?
-The assumptions for a t-test include having a suitable sample size, the variable being tested must be metric (e.g., age, body weight, income), and the metric variable must be normally distributed. For the independent samples t-test, it's also assumed that the variances in the two groups are approximately equal, which can be checked using Levine's test.
What are the null and alternative hypotheses for a one sample t-test?
-In a one sample t-test, the null hypothesis is that the sample mean is equal to the given reference value (indicating no difference), and the alternative hypothesis is that the sample mean is not equal to the given reference value (indicating a difference).
How is the T value calculated in a t-test?
-The T value in a t-test is calculated using the difference between the means and the standard error of the mean. The formula varies depending on the type of t-test being conducted, but it generally involves the sample mean, the known reference mean (for one sample t-test), the standard deviation of the data, and the number of cases in the sample.
What is a p-value in the context of a t-test?
-The p-value in a t-test indicates the probability of observing a sample deviation from the null hypothesis as extreme as, or more extreme than, the deviation calculated from the sample data. A smaller p-value suggests a lower likelihood that the observed difference is due to chance, and thus stronger evidence against the null hypothesis.
How is the decision to reject the null hypothesis made using the T value?
-The decision to reject the null hypothesis is made by comparing the calculated T value with a critical T value obtained from a table or by calculating the p-value from the T value. If the calculated T value exceeds the critical T value, or if the p-value is less than the chosen significance level (commonly 0.05), the null hypothesis is rejected.
What is the difference between a two-tailed and a one-tailed t-test?
-A two-tailed t-test considers the possibility of a significant difference in either direction (above or below the reference value), while a one-tailed t-test is concerned with a significant difference in a specific direction (either above or below the reference value). The choice between the two depends on whether the research question is interested in the direction of the difference.
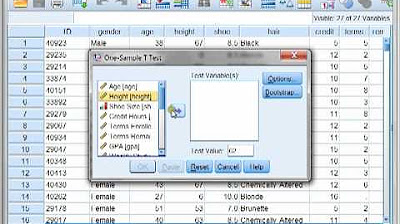
How can one interpret the results of a t-test using a software tool like DataTap?
-DataTap allows users to input their data and select the appropriate variables for the t-test. The software then calculates the t-test and provides the p-value. If the p-value is less than the significance level, the null hypothesis is rejected. DataTap also offers an interpretation in words feature, which can explain the results in a straightforward manner, such as whether there is a statistically significant difference between two groups.
Outlines
📊 Introduction to T-tests
This paragraph introduces the concept of t-tests, explaining that they are statistical procedures used to determine if there is a significant difference between the means of two groups. It outlines three types of t-tests: one sample, independent samples, and paired samples, and provides examples of when each type is used. The paragraph also discusses the assumptions necessary for a t-test, such as having a suitable sample and the variable being tested must be metric and normally distributed.
🧐 Hypotheses and Calculation of T-tests
This section delves into the hypotheses associated with t-tests, including null and alternative hypotheses for one sample, independent samples, and paired samples t-tests. It explains the need for a t-test through an example of studying differences in the length of a bachelor's degree between genders in Germany. The calculation of the T value is described, which involves determining the difference between means and the standard error. The paragraph also touches on how the T value is used in conjunction with the p-value to either read from a critical T value table or calculate the p-value to test the null hypothesis.
📉 Understanding P-values and Decision Making
The paragraph explains the concept of p-values in the context of t-tests, emphasizing that a smaller p-value indicates a more significant deviation from the null hypothesis. It discusses the significance level, typically set at 5%, which determines when there is enough evidence to reject the null hypothesis. The process of using the T value to make a decision about the null hypothesis is outlined, including looking up the critical T value from a table and calculating the p-value. The paragraph concludes with a brief mention of how to perform a t-test using an online tool and how to interpret the results.
🔍 Directed and Undirected Hypotheses
This final paragraph distinguishes between directed and undirected hypotheses in t-tests. While undirected hypotheses are concerned with whether there is a difference without specifying the direction, directed hypotheses are interested in the direction of the difference. The visual representation of the T distribution for both two-sided and one-sided tests is briefly described, noting the significance level and how it affects the decision to reject the null hypothesis.
Mindmap
Keywords
💡t-test
💡one sample t-test
💡independent samples t-test
💡paired samples t-test
💡metric variable
💡normal distribution
💡hypotheses
💡standard error
💡T value
💡p-value
💡significance level
💡degrees of freedom
Highlights
The t-test is a statistical test used to analyze significant differences between the means of two groups.
There are three types of t-tests: one sample, independent samples, and paired samples.
The one sample t-test compares a sample mean to a known reference mean.
An example of a one sample t-test is verifying a chocolate bar manufacturer's claim about average weight.
The independent samples t-test compares means of two independent groups.
The paired samples t-test is used to compare means of two dependent groups, like pre and post measurements.
Paired samples t-test can be thought of as having one sample measured at two different times.
Assumptions for a t-test include having a suitable sample and metric variables that are normally distributed.
In the independent t-test, variances in the two groups should be approximately equal.
Null hypotheses in t-tests assume no difference between groups, while alternative hypotheses suggest a difference.
The t-test helps determine if a sample's deviation from the null hypothesis is significant.
The T value is calculated using the difference between means and the standard error.
A greater T value indicates a larger difference between means, and vice versa.
The p-value represents the likelihood of drawing a sample that deviates from the population by the same amount or more.
A small p-value suggests strong evidence against the null hypothesis.
The significance level, usually set at 5%, determines when to reject the null hypothesis.
Critical T values from a table or calculated p-values help decide if the null hypothesis is rejected.
DataTap.net provides tools to calculate t-tests and interpret results.
Directed hypotheses are interested in the direction of the difference, while undirected hypotheses only care if there is a difference.
The video concludes by explaining the graphical representation of T distribution for one-tailed and two-tailed tests.
Transcripts


5.0 / 5 (0 votes)
Thanks for rating: