Student's t-test
TLDRThis video script narrates the history and application of the t-test, a statistical method developed by William Sealy Gosset under the pseudonym 'Student'. The script explains the t-test's purpose in comparing sample means to determine significant differences, using a barley yield example. It demonstrates how to calculate the T value, conduct a t-test, and utilize spreadsheets for efficiency. The video also covers the importance of the null hypothesis, critical values, degrees of freedom, and the differences between one-tailed and two-tailed tests, as well as the assumptions necessary for a valid t-test.
Takeaways
- 📚 The t-test was developed by William Sealy Gosset, who worked at Guinness Brewery over a century ago to determine differences in barley yield.
- 🤔 Gosset published the t-test under the pseudonym 'Student' due to company secrecy concerns, hence it's known as the Student's t-test.
- 🌾 The script begins with a conceptual explanation of the t-test using barley fields as an analogy for sample comparison.
- 📊 The t-test helps determine if the difference between sample means is statistically significant, considering the variance within the samples.
- 📈 The T value is calculated as a ratio of the difference between means (signal) to the variability within the groups (noise).
- 🔢 The formula for calculating the T value involves the difference between sample means, standard deviation, and sample size.
- 📋 The script demonstrates how to calculate the T value using Excel, including finding means, standard deviations, variances, and sample sizes.
- 📉 A higher T value indicates a greater difference between samples compared to the variability within the samples.
- 🧐 The t-test involves testing a null hypothesis that there's no significant difference between samples, against an alternate hypothesis that there is.
- 📊 The critical value from a t-distribution table is used to decide whether to reject the null hypothesis based on the calculated T value.
- 📝 Spreadsheets can simplify the t-test process by automatically calculating T values and p-values, making it easier to interpret results.
- 🔍 The script distinguishes between independent (unpaired) and paired t-tests, and between one-tailed and two-tailed tests.
- 📚 Assumptions for a valid t-test include normal distribution of samples, similar variances, equal sample sizes, and a sample size typically between 20 to 30.
Q & A
Who developed the t-test and under what circumstances?
-The t-test was developed by William Sealy Gosset while working at the Guinness brewery over a hundred years ago. He created the test to determine differences such as those between barley yield and had to publish it under the pseudonym 'Student' to protect the company's secrets.
What is the purpose of a t-test in statistics?
-A t-test is used to determine if there is a statistically significant difference between the means of two groups, taking into account the variability within each group.
What is the concept of 'signal' and 'noise' in the context of the t-test?
-In the t-test, 'signal' refers to the difference between the means of the two samples, indicating the effect we are interested in. 'Noise' refers to the variability within the groups, which can obscure the signal. The T value is essentially a ratio of signal to noise.
How is the T value calculated?
-The T value is calculated as the difference between the two sample means divided by the standard error of the difference. The standard error is derived from the variances and sample sizes of the two groups.
What is the significance of the mean and standard deviation in a t-test?
-The mean provides the average value of the samples, while the standard deviation indicates the spread of the data points around the mean. These values are crucial for calculating the T value and understanding the distribution of the data.
How does the number of samples affect the T value?
-Increasing the number of samples can increase the signal in the data, potentially leading to a higher T value. However, it also increases the denominator in the standard error calculation, which can have a complex effect on the T value.
What is the null hypothesis in a t-test?
-The null hypothesis in a t-test states that there is no statistically significant difference between the samples, implying that any observed difference is due to chance.
What is the critical value and how is it used in a t-test?
-The critical value is a threshold obtained from a t-distribution table, used to determine whether to reject the null hypothesis. If the calculated T value exceeds the critical value, the null hypothesis is rejected.
What does it mean if the T value is higher than the critical value?
-If the T value is higher than the critical value, it suggests that there is a statistically significant difference between the two samples, leading to the rejection of the null hypothesis.
How can a spreadsheet simplify the process of running a t-test?
-A spreadsheet can automate the calculations of means, standard deviations, variances, and the T value itself, as well as directly compute the p-value, making the t-test process much quicker and less prone to error.
What are the assumptions made when conducting a t-test?
-The assumptions for a t-test include normal distribution of the data in both the population and the sample, similar variances in the samples, equal or roughly equal sample sizes, and that the samples are either independent or paired as appropriate for the test being conducted.
What is the difference between an independent and a paired t-test?
-An independent t-test, also known as an unpaired sample t-test, compares two different groups, such as two different fields. A paired t-test compares the same group under two different conditions, such as before and after an intervention.
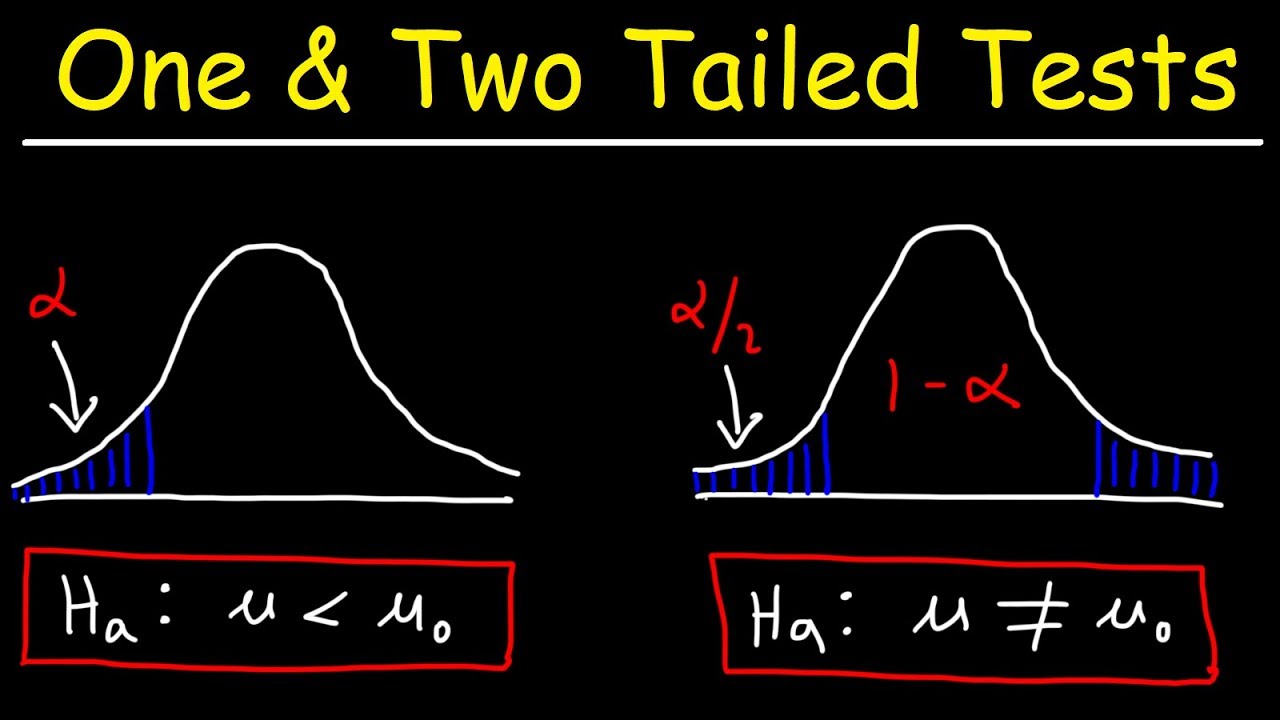
What is a two-tailed test and when is it used?
-A two-tailed test is used when the direction of the difference between the groups is not specified in advance. It splits the probability of rejecting the null hypothesis between two tails of the distribution, allowing for differences in either direction to be significant.
What does the p-value represent in the context of a t-test?
-The p-value represents the probability of observing the calculated T value (or more extreme) if the null hypothesis is true. A smaller p-value indicates stronger evidence against the null hypothesis.
Outlines
📚 Introduction to the t-test and its History
This paragraph introduces the t-test, a statistical method developed by William Sealy Gosset over a century ago while working at the Guinness Brewery. Gosset created the test to measure differences such as barley yield and had to publish it under the pseudonym 'Student' due to the brewery's secrecy concerns. The paragraph sets the stage for the video by explaining the conceptual basis of the t-test, which involves comparing samples from two groups to determine if there is a statistically significant difference in their means, taking into account the variance within each sample.
🔍 Understanding the t-test Calculation Process
The second paragraph delves into the process of calculating the t-test value using Excel. It explains the steps to find the mean and standard deviation of two sample sets, how to calculate variance by squaring the standard deviation, and the importance of sample size in the calculation. The t-test value is determined by a ratio that compares the difference between the means (signal) to the noise represented by the combined variances of the two samples. The higher the t-value, the more likely there is a significant difference between the samples, which is a key point in understanding the significance of the t-test.
📉 Conducting a t-test and Interpreting Results
This paragraph explains how to perform a t-test by testing the null hypothesis that there is no significant difference between the samples. It discusses the use of a t-distribution table to find a critical value and compares it with the calculated t-value to decide whether to reject the null hypothesis. The paragraph also introduces the concept of degrees of freedom and explains how to use a spreadsheet to quickly calculate the t-test, including the p-value, which indicates the probability of observing the data if the null hypothesis were true. The explanation covers the difference between independent and paired t-tests, as well as two-tailed and one-tailed tests, and concludes with the assumptions necessary for a valid t-test.
Mindmap
Keywords
💡t-test
💡Guinness Brewery
💡Sample
💡Mean
💡Variance
💡Standard Deviation
💡Degrees of Freedom
💡Null Hypothesis
💡Critical Value
💡P-value
💡Spreadsheet
💡Normal Distribution
💡Z-test
Highlights
The t-test was developed by William Sealy Gosset while working at Guinness Brewery over a century ago to determine differences in barley yield.
Gosset published the t-test under the pseudonym 'Student' due to the brewery's concerns about revealing trade secrets.
The t-test is used to compare means of two samples to determine if there is a statistically significant difference.
The concept of 'signal' and 'noise' is introduced, where signal represents the difference between sample means and noise represents variability within the samples.
The T value is calculated as a ratio of the difference between sample means to the standard error, indicating the presence of a significant difference.
Excel can be used to calculate the T value, including functions for mean, standard deviation, and variance.
The mean and standard deviation of each sample set are calculated using spreadsheet functions.
Variance is calculated by squaring the standard deviation, which represents the noise in the data.
The number of samples affects the signal strength in the T value calculation.
A step-by-step guide on calculating the T value using a spreadsheet is provided.
The t-test is used to test the null hypothesis that there is no significant difference between the samples.
A critical value from a t-distribution table is used to determine if the null hypothesis should be rejected.
The degrees of freedom are calculated as the total number of samples minus two for both sample sets.
Spreadsheets can quickly calculate the t-test and provide a p-value to determine the significance of the results.
The difference between an independent t-test (unpaired samples) and a paired t-test is explained.
The concept of a two-tailed test versus a one-tailed test is discussed, with the former being more common in scientific research.
Assumptions of the t-test include normal distribution of samples, similar variances, equal sample sizes, and a minimum sample size of 20-30 for reliability.
For larger sample sizes, a z-test is preferred over a t-test.
An interactive exercise is provided for viewers to practice conducting a t-test with a given sample set.
Transcripts
Browse More Related Video


5.0 / 5 (0 votes)
Thanks for rating: