Mixed Model ANOVA (Analysis of Variance) Simply explained
TLDRThis video script delves into the concept of mixed model ANOVA, a statistical technique for analyzing data with both between-subject and within-subject factors. It uses an example of different diets' effects on cholesterol levels to illustrate the method's application, explaining the necessary hypotheses, assumptions, and interpretation of results. The script guides viewers on how to conduct a mixed model ANOVA, emphasizing the importance of normality, homogeneity of variances, and sphericity, and concludes with an example and explanation of how to interpret the results, including p-values and significance levels.
Takeaways
- 📊 Mixed Model ANOVA is a statistical method for analyzing data with both between-subjects and within-subjects factors.
- 🔍 Between-subjects factors involve different subjects being exposed to different levels of a factor, while within-subjects factors involve the same subjects being exposed to all levels of a factor.
- 🍽 An example given is testing the effect of different diets (A, B, C) on cholesterol levels, with participants assigned to one diet and measured at multiple time points.
- 🧪 Mixed Model ANOVA can determine the effect of the within-subject factor (e.g., time points), the effect of the between-subject factor (e.g., diet types), and the interaction effect between the two.
- ❓ The hypotheses tested include the null hypothesis of no difference between measurement times, no difference between groups of the between-subject factor, and no interaction effect.
- 📚 Assumptions of Mixed Model ANOVA include normality of the dependent variable, homogeneity of variances, homogeneity of co-variances (sphericity), independence of observations, and absence of significant outliers.
- 📉 Violations of assumptions like normality and homogeneity of variances can be addressed with tests like Levene's test and adjustments like Greenhouse-Geisser or Huynh-Feldt.
- 📊 To perform a Mixed Model ANOVA, one can use online tools like data.net, which can calculate the analysis and provide descriptive statistics and post-hoc tests.
- 🔑 The results of the ANOVA are interpreted based on p-values, with p < 0.05 typically indicating a significant effect and rejection of the null hypothesis.
- 📝 Post-hoc tests are used to determine which specific groups differ significantly after finding a significant effect in the ANOVA.
- 🔗 For those unfamiliar with interpreting results, summary in words or graphical representations can aid in understanding the significance of the findings.
Q & A
What is a mixed model ANOVA?
-A mixed model ANOVA is a statistical method used to analyze data that involves both between-subject factors and within-subject factors. It allows for the examination of effects due to different treatments or conditions across multiple time points or occasions.
What are between-subject factors?
-Between-subject factors are variables where different subjects are exposed to different levels of the factor. In the context of the script, different diets assigned to different groups of participants are an example of between-subject factors.
What are within-subject factors?
-Within-subject factors are variables where the same subjects are exposed to all levels of the factor. For instance, measuring cholesterol levels of the same participants at different time points is an example of a within-subject factor.
What is the purpose of using a mixed model ANOVA over a one-way ANOVA or repeated measures ANOVA?
-A mixed model ANOVA is used when you have both between-subject and within-subject factors in your study design. It allows you to analyze the effects of these factors simultaneously and can provide more comprehensive insights into the data compared to using separate one-way or repeated measures ANOVAs.
What are the null hypotheses tested in a mixed model ANOVA?
-In a mixed model ANOVA, there are three null hypotheses: 1) There are no significant differences between the groups of the within-subject factor. 2) There are no significant differences between the groups of the between-subject factor. 3) There is no interaction effect between the two factors.
What are the assumptions of a mixed model ANOVA?
-The assumptions of a mixed model ANOVA include normality (the dependent variable should be approximately normally distributed within each group), homogeneity of variances (variances in each group should be equal), homogeneity of co-variances (sphericity), independence of observations, and no significant outliers.
How does the sphericity assumption relate to within-subject factors in a mixed model ANOVA?
-The sphericity assumption in a mixed model ANOVA states that the variances of the differences between all combinations of the different levels of the within-subject factor are equal. This is important for the validity of the test statistics used in the analysis.
What is the significance of the interaction effect in a mixed model ANOVA?
-The interaction effect in a mixed model ANOVA signifies whether the effect of one factor depends on the level of the other factor. A significant interaction effect indicates that the impact of one factor on the dependent variable changes across the levels of the second factor.
How can you interpret the results of a mixed model ANOVA?
-The results of a mixed model ANOVA are interpreted by examining the p-values associated with the test statistics for the null hypotheses. If the p-value is less than the significance level (commonly set at 0.05), the null hypothesis is rejected, indicating a significant effect or interaction. Post-hoc tests can further identify which specific groups differ from each other.
Can you provide an example of how to calculate a mixed model ANOVA using online tools?
-Yes, one can use online tools like Data.net to calculate a mixed model ANOVA by inputting the data into a table, selecting the appropriate variables, and choosing the hypothesis test. The tool will then provide the results of the analysis, including p-values and post-hoc tests, which can be interpreted to determine the significance of the effects.
Outlines
📊 Introduction to Mixed Model ANOVA
This paragraph introduces the concept of mixed model ANOVA, a statistical method for analyzing data with both between-subjects and within-subjects factors. The example of testing the effect of different diets on cholesterol levels is used to illustrate between-subjects factors, where different subjects are assigned to different diet groups. Within-subjects factors are exemplified by measuring cholesterol levels at different time points for the same subjects. The paragraph explains the purpose of mixed model ANOVA, which is to determine significant differences in mean cholesterol levels among groups and over time, and to assess the interaction effect between diet types and time points.
🔍 Hypotheses, Assumptions, and Interpretation of Mixed Model ANOVA
The second paragraph delves into the hypotheses tested in a mixed model ANOVA, including the null hypotheses for no difference in mean values over time, between different therapy groups, and no interaction effect between the two factors. It outlines the assumptions necessary for the analysis, such as normality, homogeneity of variances, sphericity, independence of observations, and absence of significant outliers. The paragraph also guides on how to interpret the results of a mixed model ANOVA using an example dataset, emphasizing the significance of P-values in rejecting or failing to reject the null hypotheses.
📉 Results Interpretation and Significance in Mixed Model ANOVA
The final paragraph focuses on interpreting the results of a mixed model ANOVA, highlighting the significance of P-values in determining whether cholesterol levels differ significantly over time and between therapy types. It explains that a P-value less than 0.05 indicates a significant effect, while a P-value greater than 0.05 suggests no significant effect. The paragraph also discusses the importance of understanding the mean values over time points and the potential for interactions between therapies and time. It concludes by noting the lack of a significant interaction in the given example, indicating that the therapy's influence over time is consistent regardless of the therapy type used.
Mindmap
Keywords
💡Mixed Model ANOVA
💡Between-Subjects Factors
💡Within-Subjects Factors
💡Hypotheses
💡Assumptions
💡Normality
💡Homogeneity of Variances
💡Sphericity
💡Independence of Observations
💡Outliers
💡Interpretation of Results
Highlights
Mixed model ANOVA is a statistical method for analyzing data with both between and within subjects factors.
Between subjects factors involve different subjects exposed to different levels of a factor.
Within subjects factors involve the same subjects exposed to all levels of a factor.
A mixed model ANOVA can determine if there are significant differences in mean cholesterol levels among different diets.
Repeated measures ANOVA is used to examine the impact of one diet across multiple time points.
A mixed model ANOVA combines both between and within subjects factors to analyze data.
The analysis can answer the effect of within subject factors, between subject factors, and their interaction on a dependent variable.
Three null hypotheses are tested in a mixed model ANOVA: no difference over time, no difference between groups, and no interaction effect.
Assumptions of mixed model ANOVA include normality, homogeneity of variances, homogeneity of co-variances, and independence of observations.
Violation of normality is a concern especially with small sample sizes.
Levene's test can be used to check the homogeneity of variances assumption.
Mauchly's test of sphericity assesses the homogeneity of co-variances assumption for within subjects factors.
Adjustments like Greenhouse-Geisser or Huynh-Feldt can be used if sphericity is violated.
Outliers can significantly affect ANOVA results and should be addressed if present.
Data can be analyzed online using platforms like data.net for mixed model ANOVA.
Descriptive statistics and ANOVA results, including post-hoc tests, are provided in the output.
Significance levels and P-values determine whether null hypotheses are rejected.
No significant interaction between therapy type and time indicates a uniform influence over time regardless of therapy.
Post-hoc tables show which combinations of factors differ significantly.
Transcripts
Browse More Related Video

Pretest and Posttest Analysis with ANCOVA and Repeated Measures ANOVA using SPSS

One way ANOVA using Excel(one way anova)(ANOVA)(anova)(excel)(EXCEL)
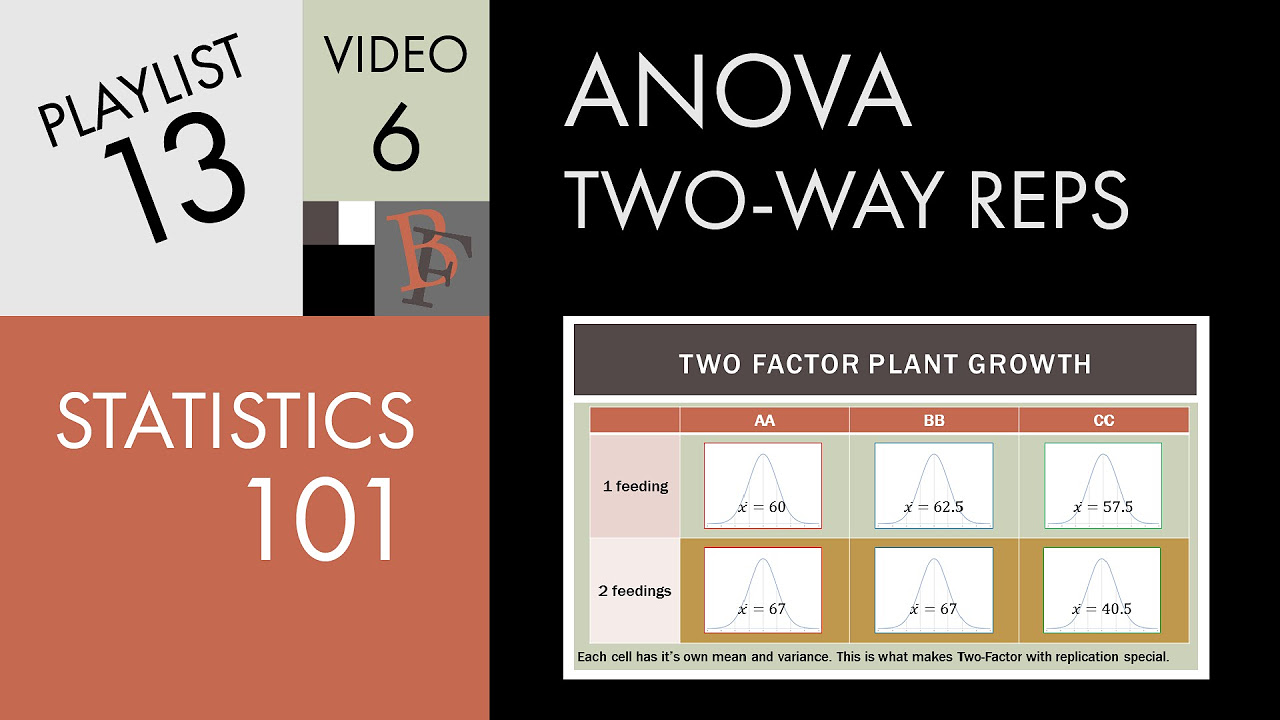
Statistics 101: Two-way ANOVA with Replication, An Introduction

Significance vs. Effect Size for One Way ANOVA using SPSS
Two factor ANOVA with repeated measures

t-Test - Full Course - Everything you need to know
5.0 / 5 (0 votes)
Thanks for rating: