One way ANOVA using Excel(one way anova)(ANOVA)(anova)(excel)(EXCEL)
TLDRThis educational video script introduces One Way Anova, a statistical technique to compare sample means and determine if they are significantly different. It distinguishes One Way Anova from Two Way Anova, explaining that the former uses one independent variable while the latter uses two. The script provides a practical example of an oil company analyzing gasoline sales across three cities using Excel to perform the Anova analysis. It details the steps to input data, perform the analysis, and interpret the results, including calculating the F-statistic and P-value to make conclusions about the sales variance between cities.
Takeaways
- 📚 One Way ANOVA is a statistical method used to compare if the means of two or more samples are significantly different.
- 🔍 The difference between One Way and Two Way ANOVA is that One Way has one independent variable, while Two Way has two.
- 🌱 An example of One Way ANOVA application is comparing the effects of three different fertilizer mixtures on crop yield.
- 📉 The full form of ANOVA is 'Analysis of Variance', which is used to analyze the variance between and within groups.
- 🏢 A practical example given in the script is an oil company analyzing the sales of a new gasoline brand across three metropolitan cities.
- 📊 The data for the ANOVA is organized by city, with each city representing a different group, and sales data from 10 outlets per city.
- 🧑🏫 The script explains the setup for conducting ANOVA in Excel, including enabling the 'Analysis ToolPak' add-in.
- 📝 Key components of ANOVA results include Sum of Squares (SS), Degrees of Freedom, Mean Square (MS), and F-statistics.
- 📉 The F-statistic is calculated by dividing the Mean Square between groups by the Mean Square within groups.
- 🔑 A low P-value (less than 0.05) indicates that the results are statistically significant, leading to the rejection of the null hypothesis.
- 🚫 If the P-value is greater than 0.05, the null hypothesis is not rejected, suggesting no significant difference between the groups.
- 📝 The script concludes that the sales of the new gasoline brand are significantly different across the three cities, based on the ANOVA results.
Q & A
What is One Way Anova used for in statistics?
-One Way Anova is a statistical technique used to compare whether the means of two or more samples are significantly different from each other.
What is the difference between One Way Anova and Two Way Anova?
-One Way Anova involves only one independent variable, whereas Two Way Anova is used when there are two independent variables to analyze the effect of both variables on the dependent variable.
Can you provide an example of when One Way Anova would be applied?
-An example of One Way Anova application is when comparing the effects of three different fertilizer mixtures on crop yield to determine if there is any significant difference among them.
What is the full form of ANOVA?
-The full form of ANOVA is Analysis of Variance.
What are the null and alternative hypotheses in the context of the gasoline sales example?
-The null hypothesis states that the average sale of the new brand of gasoline is the same in all three metro cities. The alternative hypothesis states that the average sale of the new brand of gasoline is not the same in all the metro cities.
How does the speaker organize the data in Excel for the One Way Anova analysis?
-The speaker organizes the data by creating separate columns for each metro city (Delhi, Mumbai, Kolkata), with each column containing the average daily sales figures from 10 selected outlets in each city.
What Excel add-in is required to perform One Way Anova analysis?
-The Analysis ToolPak add-in is required to perform One Way Anova analysis in Excel.
What does SS stand for in ANOVA?
-SS stands for Sum of Squares, which quantifies the variability between or within the groups in ANOVA.
What is the significance of the F statistic and P value in ANOVA?
-The F statistic is used to determine the ratio of the variance between groups to the variance within groups. A P value less than 0.05 indicates that the results are statistically significant, leading to the rejection of the null hypothesis.
How does the speaker verify the results of the Excel One Way Anova analysis?
-The speaker verifies the results by comparing the F value and P value obtained from the Excel analysis with the results from SPSS, ensuring that the outcomes are consistent.
What conclusion does the speaker draw from the One Way Anova analysis of gasoline sales?
-The speaker concludes that the average sale of the new brand of gasoline is significantly different across the three metro cities, rejecting the null hypothesis and accepting the alternative hypothesis.
Outlines
📊 Introduction to One Way ANOVA
This paragraph introduces the concept of One Way ANOVA, a statistical technique used to compare if the means of two or more samples are significantly different. It differentiates One Way ANOVA from Two Way ANOVA, explaining that the former involves a single independent variable, while the latter includes two. The paragraph provides an example of applying ANOVA to compare the effects of three different fertilizer mixtures on crop yield. It also discusses the full form of ANOVA, which stands for 'Analysis of Variance,' and sets up a scenario involving an oil company testing the sales of a new gasoline brand in three metropolitan cities to illustrate the practical application of One Way ANOVA.
📈 Conducting One Way ANOVA with Excel
The speaker demonstrates how to perform a One Way ANOVA analysis using Excel. They explain the process of setting up the data for three metropolitan cities—Delhi, Mumbai, and Kolkata—and how to use Excel's Analysis ToolPak to conduct the ANOVA. The paragraph details the steps of selecting the input range, choosing the grouped by columns, and specifying the output range for the results. It also explains the statistical terms involved in the ANOVA output, such as sum of squares (SS), degrees of freedom, mean square (MS), and F-statistics, which are used to determine the significance of the results.
📉 Interpreting One Way ANOVA Results
This paragraph focuses on interpreting the results of the One Way ANOVA analysis. The speaker explains the significance of the P-value and F-statistics in determining whether to accept or reject the null hypothesis. If the P-value is less than 0.05, the null hypothesis is rejected, indicating that there is a significant difference in the average sale of the gasoline brand across the three cities. The speaker also compares the results obtained from Excel with those from SPSS, confirming the consistency of the outcomes. The conclusion is that the average sale of the new gasoline brand is not the same in all three metropolitan cities, thus supporting the alternate hypothesis.
Mindmap
Keywords
💡One Way Anova
💡Independent Variable
💡Dependent Variable
💡Null Hypothesis
💡Alternate Hypothesis
💡Significance Level
💡Excel
💡Analysis ToolPak
💡Degrees of Freedom
💡Mean Square
💡F-Statistic
💡P-Value
Highlights
Introduction to One Way Anova as a statistical technique to compare sample means for significant differences.
Explanation of the difference between One Way and Two Way Anova, highlighting the presence of one independent variable in One Way Anova.
Example given of using One Way Anova to compare crop yields among three different fertilizer mixtures.
Full form of Anova is 'Analysis of Variance', discussed to clarify the technique's purpose.
Case study of an oil company using One Way Anova to analyze the sale of a new gasoline brand in three major cities.
Description of the null hypothesis stating that the average sale of the new gasoline brand is the same in all metro cities.
Presentation of the alternate hypothesis suggesting that the average sale of the new gasoline brand is not the same across cities.
Demonstration of how to perform One Way Anova using Excel, including the steps to access the Analysis ToolPak.
Explanation of the input range selection in Excel for the Anova analysis, including the grouping by columns for different cities.
Discussion of the output range in Excel for the Anova results and the decision to place it on a new worksheet.
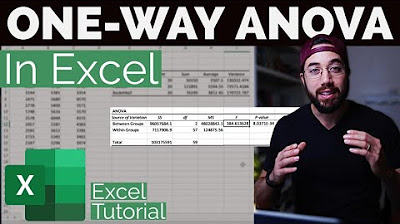
Presentation of the Anova results in Excel, including the sum, average, and variance calculations for each city.
Explanation of the Anova components such as SS (Sum of Squares), degrees of Freedom, and MS (Mean Square).
Calculation of F-statistics and its significance in determining if the differences between groups are statistically significant.
Interpretation of the P-value in the context of Anova, with a threshold of less than 0.05 indicating significance.
Comparison of Anova results obtained from Excel with those from SPSS to validate the findings.
Conclusion that the average sale of the new gasoline brand is significantly different across the three metro cities based on the Anova analysis.
Announcement of upcoming videos covering Two Way Anova and post-hoc tests for further statistical analysis.
Transcripts
Browse More Related Video

ANOVA: One-way analysis of variance

Excel - One-Way ANOVA Analysis Toolpack
One-way ANOVA & Post-Hoc Analysis in Excel

ANOVA (Analysis of variance) simply explained

ANOVA (Analysis of Variance) and Sum of Squares | Statistics Tutorial #26 | MarinStatsLectures

SPSS (9): Mean Comparison Tests | T-tests, ANOVA & Post-Hoc tests
5.0 / 5 (0 votes)
Thanks for rating: