Position vs. Time Graph - Part 1
TLDRIn this educational video, Mr. Andersen introduces the concept of position versus time graphs, focusing on objects with constant velocity. He emphasizes the importance of understanding how to interpret these graphs to determine an object's motion, including the ability to transition from a position-time graph to a velocity-time graph and vice versa. Using the Moving Man simulation from the University of Colorado, Andersen demonstrates how changes in position over time can be visualized and analyzed, highlighting that the slope of the graph represents velocity. He concludes by encouraging viewers to practice with the simulation and look forward to part 2, which will cover acceleration and deceleration.
Takeaways
- 📈 The concept of position versus time graphs is introduced, focusing on objects with constant velocity in Part 1 and acceleration/deceleration in Part 2.
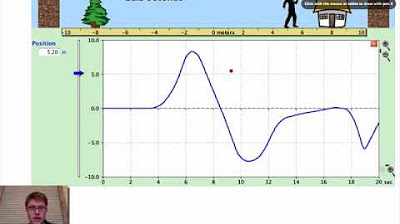
- 🚶 The Moving Man simulation from the University of Colorado is highlighted as a tool for understanding position versus time graphs through interactive learning.
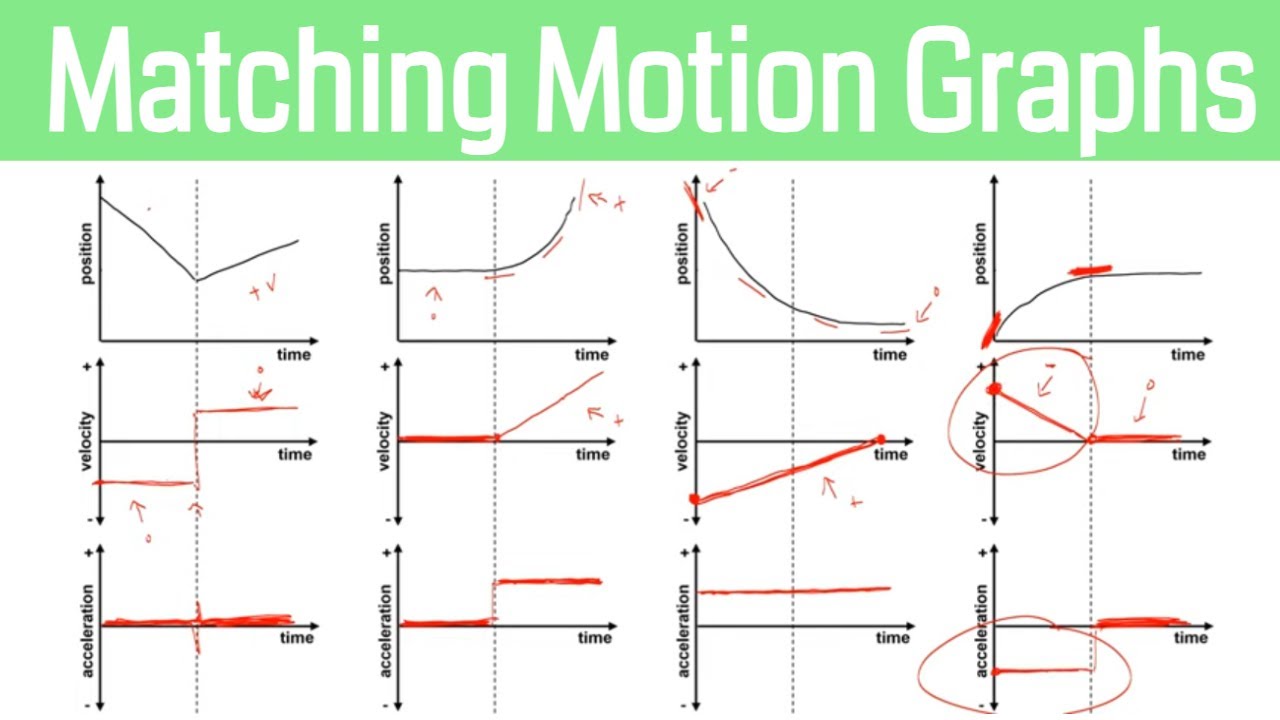
- 📊 Position is represented on the y-axis, while time is on the x-axis in a position versus time graph.
- 🏃 The slope of the line in a position versus time graph indicates the velocity of the object, with positive and negative slopes representing direction of movement.
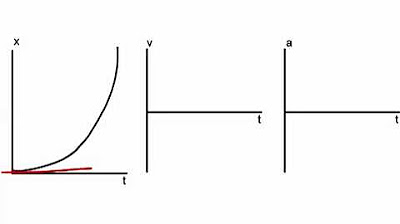
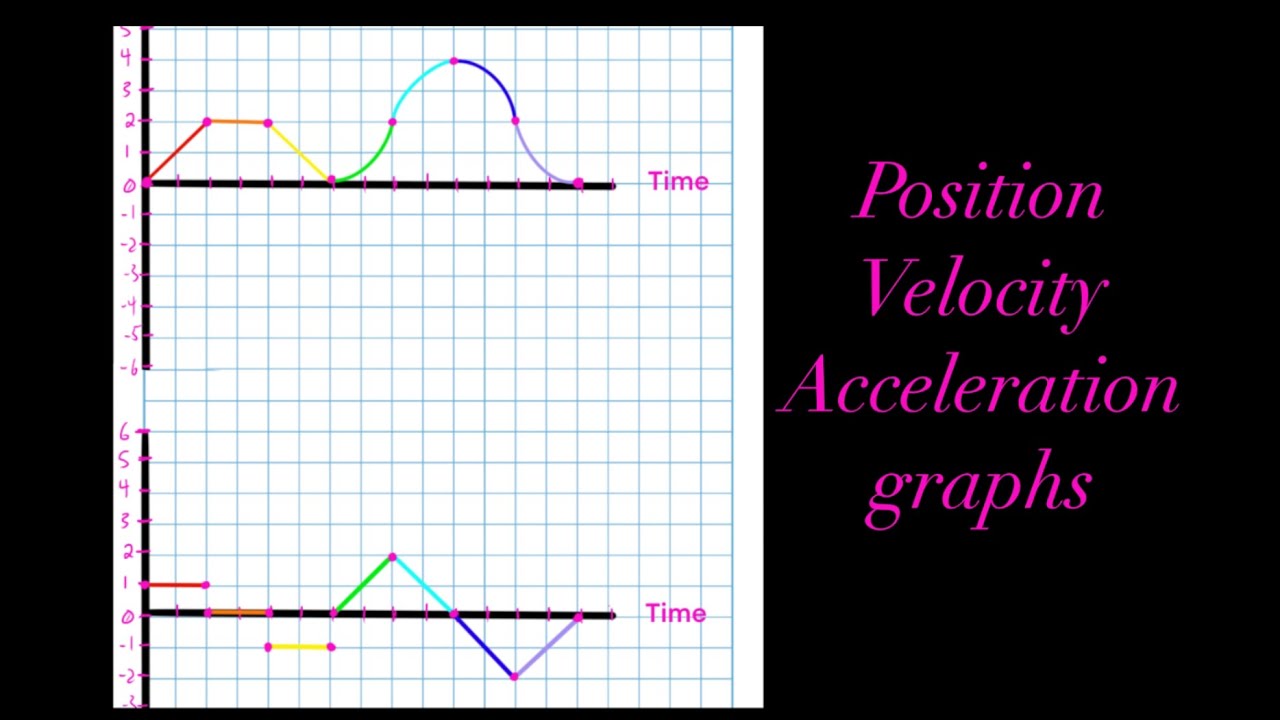
- 🔄 Understanding the graph allows one to transition from a position versus time graph to a velocity versus time graph, and eventually to an acceleration versus time graph.
- 🤹 The importance of graph interpretation is emphasized, where one should be able to deduce an object's motion just by looking at the graph.
- 📐 The script provides a practical example of converting a position versus time graph into a velocity versus time graph by calculating the slope.
- 📉 A straight line in the position versus time graph indicates constant velocity, while a curved line suggests changing velocity.
- 🎯 The Moving Man simulation can be used to practice and solidify understanding of position versus time graphs and their conversion to velocity graphs.
- 📚 The video script serves as a foundation for solving problems on tests, emphasizing the application of learned concepts in practical scenarios.
Q & A
What is the main topic of the video?
-The main topic of the video is the concept of position versus time graphs, specifically for objects with constant velocity.
What is the purpose of the unit on position versus time graphs?
-The purpose of the unit is to enable viewers to understand and interpret position versus time graphs, and to be able to derive velocity and acceleration from these graphs.
What is The Moving Man?
-The Moving Man is a simulation created at the University of Colorado that allows users to manipulate the position of a man over time to better understand position versus time graphs.
How does the slope of a position versus time graph relate to velocity?
-The slope of a position versus time graph is directly equivalent to the velocity of the object. A positive slope indicates movement to the right, while a negative slope indicates movement to the left.
What does the y-axis represent in a position versus time graph?
-In a position versus time graph, the y-axis represents the position of the object.
What does the x-axis represent in a position versus time graph?
-In a position versus time graph, the x-axis represents time.
How can you determine if an object is moving at a constant velocity from the graph?
-An object is moving at a constant velocity if the line on the position versus time graph is a straight line, indicating no change in speed or direction.
What is the formula for calculating velocity?
-The formula for calculating velocity is the final position minus the initial position, divided by the final time minus the initial time.
How can you transition from a position versus time graph to a velocity versus time graph?
-You can transition from a position versus time graph to a velocity versus time graph by calculating the slope of the line at different intervals and plotting these slopes against time to create the velocity graph.
What does a curved line in a position versus time graph indicate?
-A curved line in a position versus time graph indicates that the object's velocity is changing, meaning the object is accelerating or decelerating.
Where can one go to practice with The Moving Man simulation?
-You can practice with The Moving Man simulation at phet.colorado.edu.
Outlines
📊 Introduction to Position vs. Time Graphs
This paragraph introduces the concept of position versus time graphs, emphasizing the importance of understanding constant velocity objects in part 1 and acceleration and deceleration in part 2. Mr. Andersen explains the educational purpose of these graphs, which is to enable students to interpret an object's motion from its graph. He introduces The Moving Man, a simulation from the University of Colorado, as a tool to visually understand position versus time graphs and encourages students to explore it, regardless of their current understanding of the topic.
🏃♂️ Analyzing Constant Velocity with The Moving Man
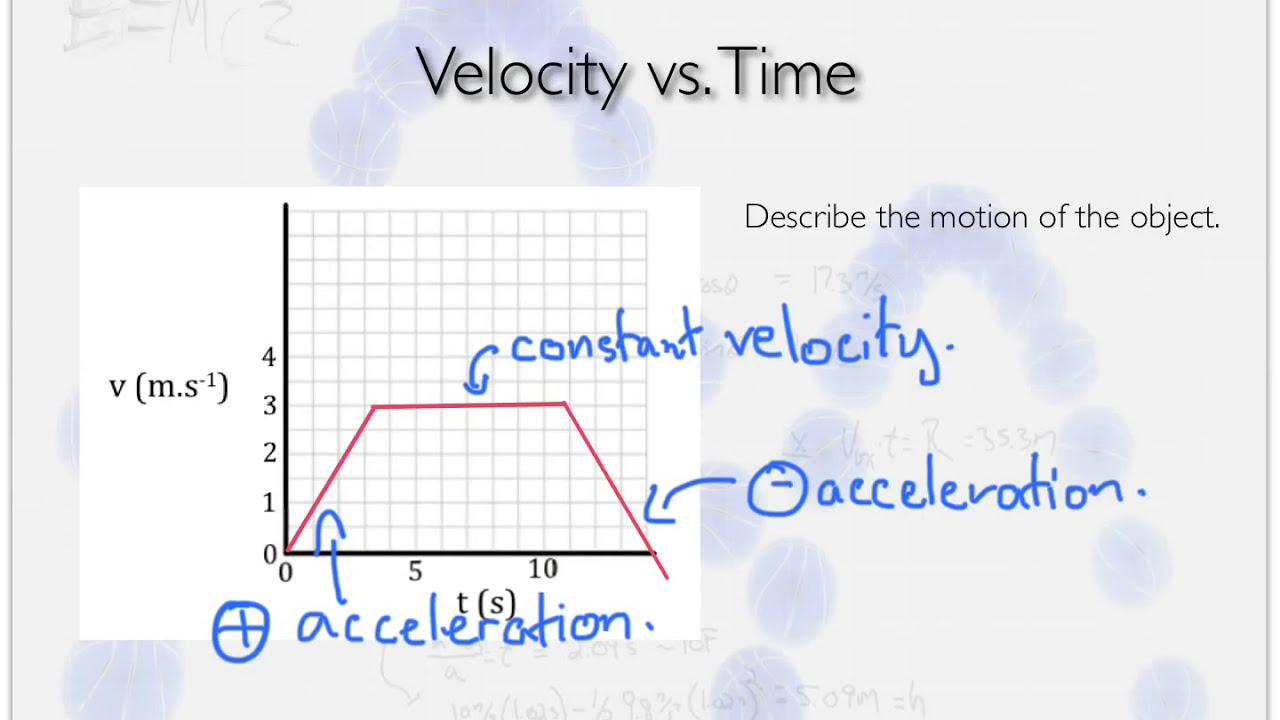
In this paragraph, Mr. Andersen uses The Moving Man simulation to demonstrate how a position versus time graph can reflect an object's constant velocity motion. He explains that a straight line in the graph indicates constant velocity and that the slope of the line represents the speed. He also discusses how the direction of the line's slope (positive or negative) indicates the direction of motion. The paragraph includes a practical example of calculating velocity from a graph and transitioning from a position versus time graph to a velocity versus time graph.
📉 Interpreting Velocity Changes from Position Graphs
The final paragraph delves into the interpretation of non-linear position versus time graphs, which indicate changing velocities. Mr. Andersen explains how a curving line on the position graph reflects a change in velocity over time. He encourages students to practice this skill and offers guidance on how to transition from interpreting position graphs to understanding velocity changes. The paragraph concludes with a recommendation to watch part 2 of the series for further insights and encourages students to use The Moving Man simulation for hands-on learning.
Mindmap
Keywords
💡Position versus Time Graphs
💡Constant Velocity
💡Acceleration
💡Deceleration
💡The Moving Man
💡Slope
💡Velocity
💡PhET Simulations
💡Graphing
💡Conceptual Understanding
Highlights
Introduction to position versus time graphs, focusing on objects with constant velocity.
Explanation of how to interpret position versus time graphs to understand an object's motion.
The Moving Man simulation as a tool for understanding position versus time graphs.
Demonstration of how to use The Moving Man to graph an object's position over time.
Illustration of constant velocity through a straight line on the position versus time graph.
Conversion from position versus time graph to velocity versus time graph using slope.
Explanation of the relationship between slope and velocity, where slope equals velocity.
Example calculation of velocity from a position versus time graph.
Description of how to graph velocity versus time from a given position versus time graph.
Discussion of the implications of a curving line on the position versus time graph indicating changing velocity.
Advice on using The Moving Man simulation for practice and understanding of graphing concepts.
The importance of understanding how to convert from position versus time to velocity versus time graphs for problem-solving.
The significance of the direction of the slope in relation to the object's movement direction.
Mention of the upcoming part 2 of the series, which will cover acceleration and deceleration.
The practical application of graphing in understanding the physical behavior of objects in motion.
The clear distinction between position, velocity, and acceleration graphs and their interpretations.
The accessibility of The Moving Man simulation for further exploration and learning.
Transcripts
Browse More Related Video

5.0 / 5 (0 votes)
Thanks for rating: