How to match motion graphs in physics (more examples)
TLDRThe transcript discusses the interpretation of motion through graphs, explaining how the slope of position versus time graphs reflects velocity and acceleration. It outlines various scenarios, such as constant velocity, changes in direction with constant speed, and deceleration to a stop, highlighting the relationship between the graphs' slopes and the physical quantities they represent. The explanation is methodical, walking through each motion's characteristics and their graphical representation, ultimately aiming to help users understand the dynamics of motion as depicted on velocity and acceleration graphs.
Takeaways
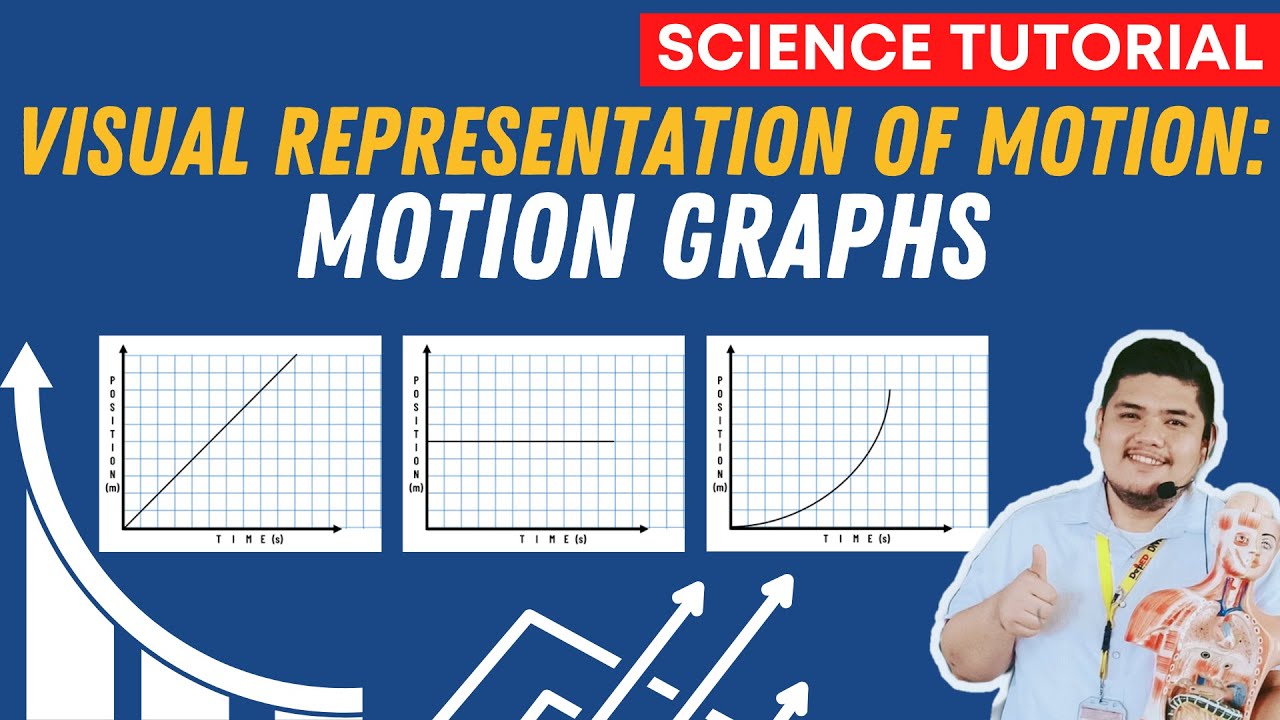
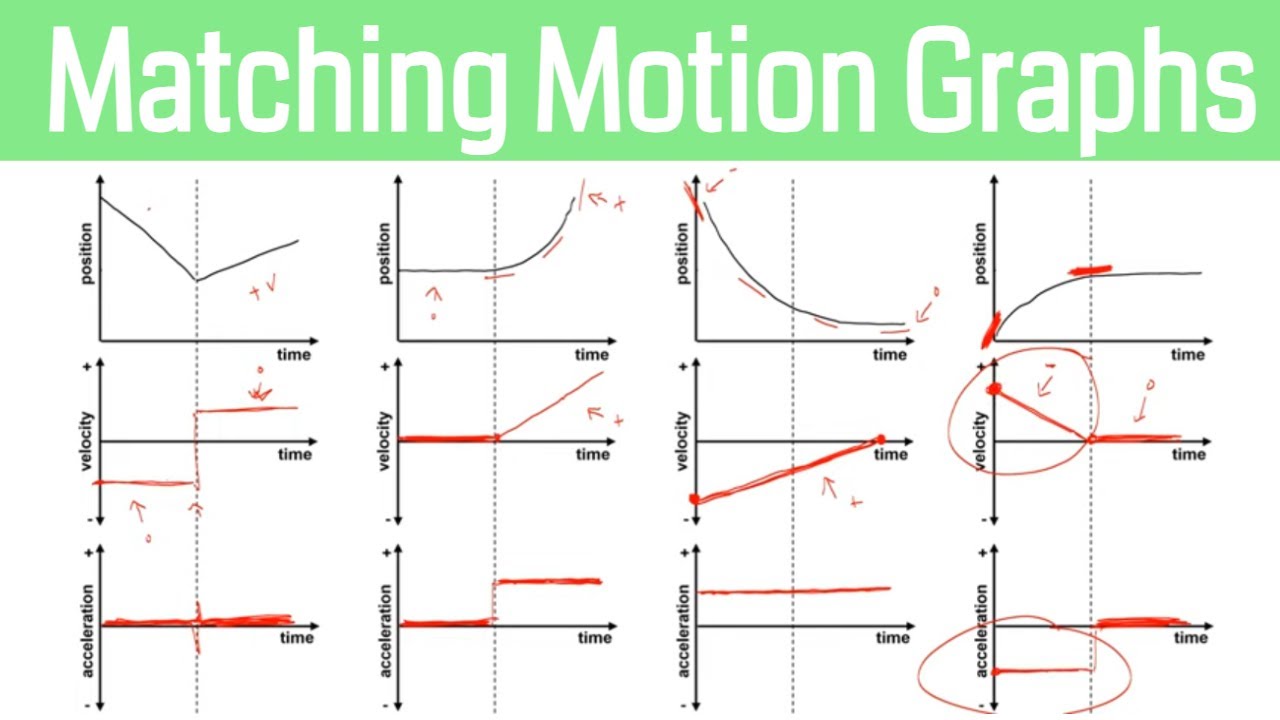
- 📈 The slope of a position-time graph indicates velocity; a constant slope signifies constant velocity.
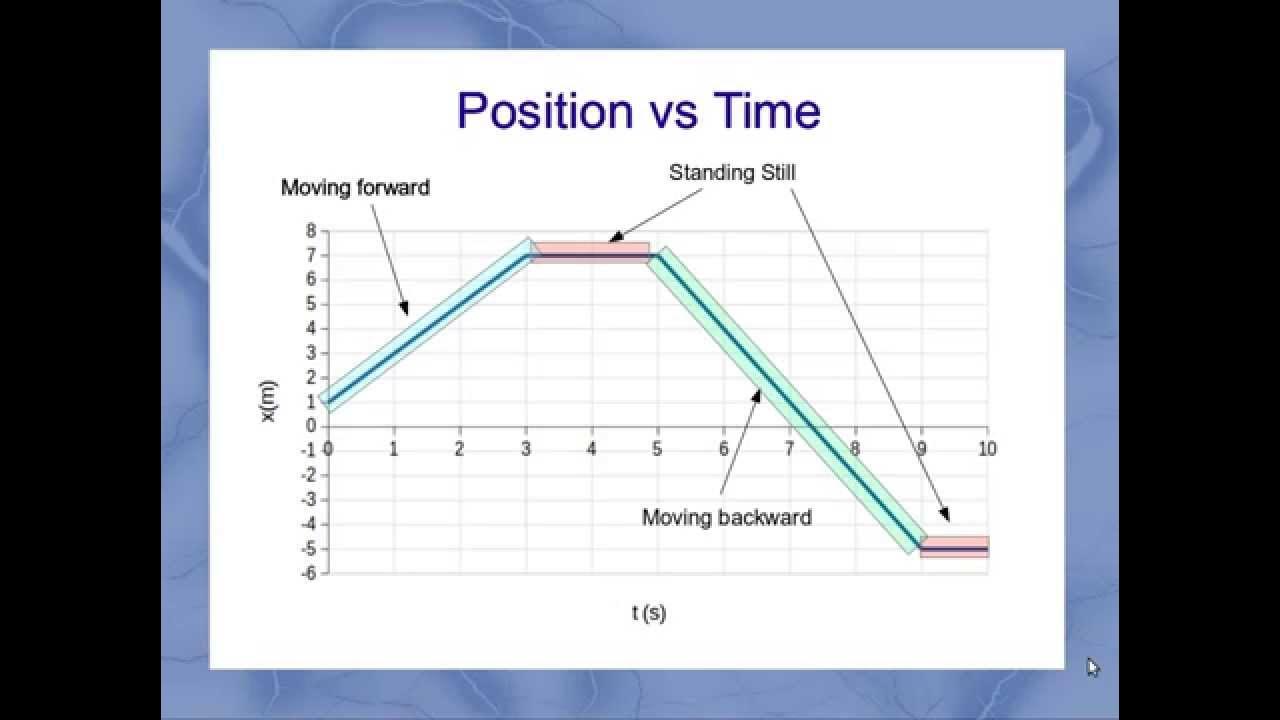
- 🏃 A positive slope in the position-time graph represents motion in the positive direction with constant velocity.
- 🔄 A jerk in velocity is indicated by a sudden change in the slope of the position-time graph from positive to negative.
- 📉 A negative slope in the position-time graph signifies motion in the negative direction with increasing speed.
- 🚫 A flat line in the velocity-time graph indicates constant velocity with no acceleration.
- 🚀 A straight line with a positive slope in the velocity-time graph denotes constant positive acceleration.
- 🛑 A straight line with a negative slope in the velocity-time graph indicates constant negative acceleration.
- 📌 A change from zero slope to a negative slope in the position-time graph means the object transitions from rest to moving left with increasing speed.
- ⏪ A motion with a positive velocity followed by a flat line indicates the object decelerates to a stop before moving with constant speed.
- 🔄 A motion with a positive slope transitioning to zero and then to a negative slope signifies the object slowing down to a stop and then moving left with decreasing speed.
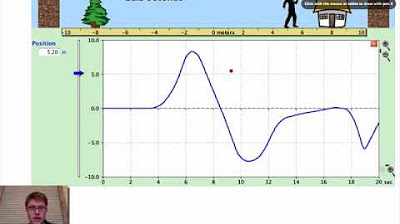
- 🔄 A motion described by an 'S' curve in the position-time graph indicates the object first speeds up to the right, then slows down to a stop.
Q & A
What does a constant slope in the position versus time graph indicate?
-A constant slope in the position versus time graph indicates a constant velocity, meaning the object is moving at a steady speed without acceleration.
How can you determine if an object is accelerating or decelerating from the velocity versus time graph?
-If the slope of the velocity versus time graph is positive and constant, the object is accelerating. If the slope is negative and constant, the object is decelerating. A flat line indicates no acceleration or deceleration, meaning constant velocity.
What is the relationship between the slope of the position versus time graph and the velocity of an object?
-The slope of the position versus time graph is directly related to the velocity of the object. A positive slope indicates positive velocity, while a negative slope indicates negative velocity.
How can you identify the point at which an object changes direction in its motion?
-A change in the slope of the position versus time graph from positive to negative or vice versa indicates a change in direction of the object's motion.
What does a flat line in the acceleration versus time graph signify?
-A flat line in the acceleration versus time graph indicates that the acceleration is constant, meaning the rate of change of velocity is uniform throughout the time period depicted.
How does the steepness of the slope in the position versus time graph relate to the speed of the object?
-The steepness of the slope in the position versus time graph is proportional to the speed of the object. A steeper slope indicates a higher speed, while a shallower slope indicates a lower speed.
What is the significance of a zero slope in the position versus time graph?
-A zero slope in the position versus time graph signifies that the object's velocity is zero, meaning the object is at rest or not moving.
How can you determine if there is a change in acceleration from the velocity versus time graph?
-A change in the slope of the velocity versus time graph indicates a change in acceleration. If the slope increases or decreases, this represents an increase or decrease in acceleration, respectively.
What does a positive slope in the acceleration versus time graph mean?
-A positive slope in the acceleration versus time graph means that the acceleration is positive, indicating that the object is speeding up in the positive direction.
How can you describe the motion of an object that starts with a positive velocity and then slows down to zero?
-The object starts moving in the positive direction at a constant speed and then decelerates until it comes to a complete stop, at which point the velocity is zero.
What is the motion described by a transition from a positive slope to a zero slope in the position versus time graph?
-This motion describes an object that starts moving in the positive direction with a constant velocity and then gradually slows down until its velocity reaches zero.
Outlines
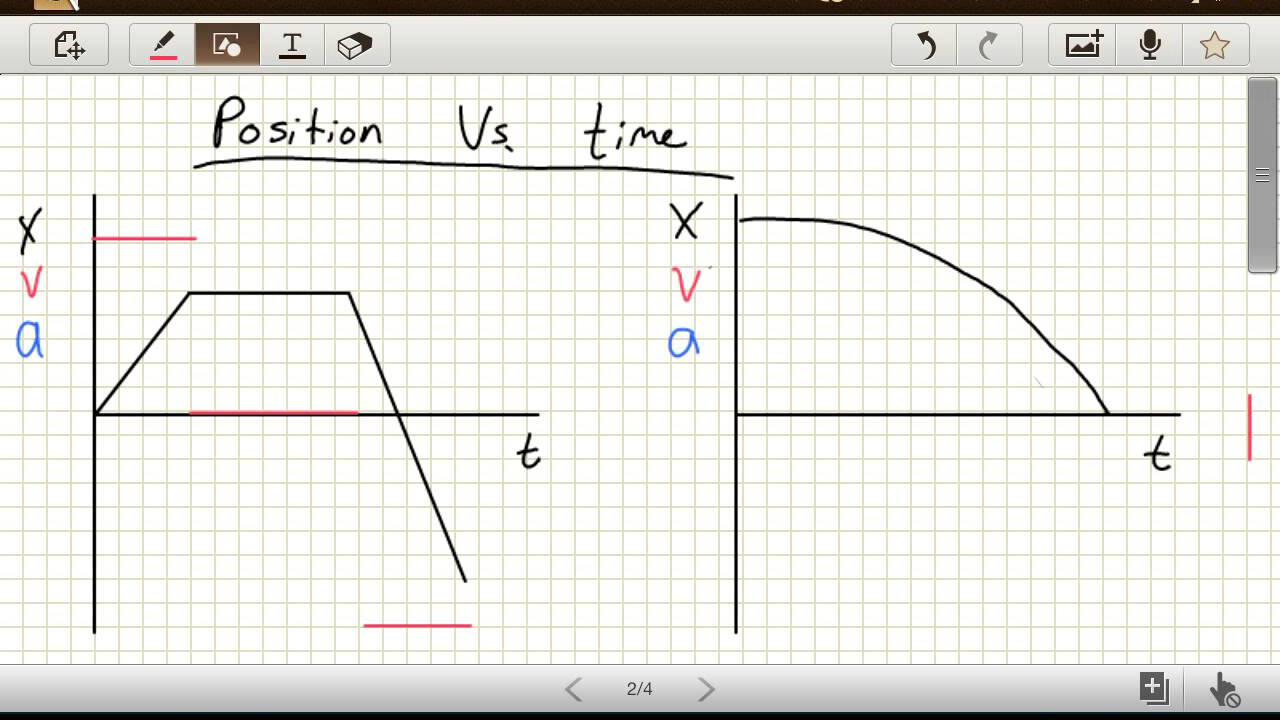
📈 Analysis of Constant Velocity and Acceleration
This paragraph discusses the interpretation of a motion graph with a constant positive slope in the first section, indicating a constant positive velocity. A sudden change in velocity is described, marked by a negative slope in the position vs. time graph. The steepness of the negative slope suggests a faster velocity in the opposite direction. The constant velocity in both positive and negative directions is indicated by flat lines in the velocity vs. time graph. The absence of slope in both velocity and acceleration graphs signifies no acceleration. The motion is described as an object moving with constant velocity in the positive direction, then changing direction with increased speed but maintaining constant velocity.
🛑 Starting from Rest and Accelerating
The second paragraph explains a motion starting from rest with zero velocity, as indicated by a flat slope, and then accelerating to a positive velocity with a positive slope. The constant slope in the velocity vs. time graph represents a constant acceleration. The motion is described as an object at rest that begins to speed up in the positive direction, with the velocity increasing as it moves forward.
Mindmap
Keywords
💡Slope
💡Velocity
💡Acceleration
💡Jerk
💡Positive Direction
💡Negative Direction
💡Constant
💡Flat Line
💡Zero Velocity
💡Deceleration
Highlights
Positive slope in the first graph indicates a constant positive velocity.
A flat line in the velocity graph signifies no change in velocity.
Jerk represents a quick change in velocity, marked by a negative slope in the position vs. time graph.
The steepness of the slope in the position vs. time graph correlates with the speed of the object in the opposite direction.
Zero slope in both position vs. time and velocity vs. time graphs implies no acceleration.
Flat slope at the beginning indicates an initial velocity of zero.
Positive slope in the velocity vs. time graph indicates a constant positive acceleration.
Constant slope in the velocity vs. time graph reflects a constant acceleration.
Negative slope in the position vs. time graph corresponds to a negative velocity.
Flat line in the acceleration vs. time graph indicates a constant acceleration.
Zero velocity followed by a negative slope signifies starting from rest and moving with increasing negative velocity.
Positive slope followed by zero indicates starting with positive velocity and coming to a stop.
Negative acceleration with positive velocities means the object is slowing down while maintaining a positive velocity direction.
An S-curve in the position vs. time graph indicates a change from constant velocity to deceleration followed by a stop.
The direction of acceleration and velocity being the same indicates speeding up in the negative direction.
An initial positive slope followed by a return to zero slope reflects a motion starting with constant speed and then slowing down to a stop.
The absence of slope in the velocity graph after an initial positive slope indicates a transition from constant speed to deceleration.
The motion described by the seventh graph involves constant speed to the left followed by an increase in speed to the left.
The final graph describes a motion that starts by speeding up to the right, then slows down to a stop.
Transcripts
5.0 / 5 (0 votes)
Thanks for rating: