Two factor ANOVA with repeated measures
TLDRThis video script delves into two-factor analysis of variance with repeated measures, a statistical method to determine if differences exist between more than two samples across two variables, with one variable involving dependent samples. It explains the concept of dependent samples, where the same subjects are measured at different times, and contrasts this with single-factor ANOVA with repeated measures. The script outlines the hypotheses tested, including main effects and interaction effects, and discusses the assumptions necessary for the analysis. An example with blood pressure data illustrates the process of conducting and interpreting the results of a two-factor ANOVA with repeated measures using an online tool.
Takeaways
- 📚 The video discusses two-factor analysis of variance with repeated measures, a statistical method used to test for differences between more than two samples across two variables or factors with one factor involving repeated measures.
- 🔍 The distinction is made between one-factor and two-factor analysis of variance, with the latter involving either repeated or non-repeated measures.
- 📈 Two-factor ANOVA with repeated measures is used to determine if there are significant differences due to the interaction of two factors, such as different therapies and their effects over time in a study.
- 🔬 The concept of a dependent sample is explained, where the same subjects are measured at multiple time points, such as blood pressure readings before, during, and after therapy.
- 🚫 The difference between single-factor ANOVA with repeated measures and two-factor ANOVA with repeated measures is highlighted, with the latter allowing for the analysis of two variables.
- 💡 The video explains that two-factor ANOVA with repeated measures can be used to assess the influence of the first factor (e.g., time points), the second factor (e.g., therapy type), and their interaction effect on the dependent variable.
- 🧐 Three null hypotheses are tested: no difference across measurement times, no difference between therapy types, and no interaction effect between the two factors.
- 📝 Assumptions for the analysis include metric level for the dependent variable, categorical level for the factors, independence and dependence of measurements as appropriate, equal variances, and normal distribution of data within groups.
- 📊 An example is provided to illustrate how to interpret the results of a two-factor ANOVA with repeated measures, including how to calculate and understand p-values in relation to the null hypotheses.
- 🛠 The video suggests using an online tool like datadep.net for calculating two-factor ANOVA with repeated measures, guiding viewers through the process of inputting data and interpreting the output.
- 🔑 The importance of p-values is emphasized, with a significance level often set at 5%, to determine whether to reject or retain the null hypotheses based on the results of the analysis.
Q & A
What is the main focus of the video?
-The video focuses on explaining two-factor analysis of variance with repeated measures, including its purpose and how it differs from one-factor analysis of variance.
What distinguishes two-factor analysis of variance with repeated measures from one-factor analysis of variance?
-Two-factor analysis of variance with repeated measures involves testing for differences across more than two variables or factors, with one of the factors being created by repeated measures, as opposed to one-factor analysis which tests for differences between three or more dependent samples.
What is a dependent sample in the context of this video?
-A dependent sample refers to a situation where the measured values are connected, such as measuring the same person at several points in time, like blood pressure readings before, during, and after therapy.
What are the three things that can be determined using two-factor analysis of variance with repeated measures?
-With this analysis, one can determine if the first factor (measurement repetitions) influences the dependent variable, if the second factor influences the dependent variable, and if there is an interaction effect between the two factors.
What are the three null hypotheses tested in two-factor analysis of variance with repeated measures?
-The three null hypotheses are: 1) There are no significant differences between the groups of the first factor (measurement times), 2) There are no significant differences between the groups of the second factor, and 3) There is no interaction effect between the two factors.
What are the assumptions required for two-factor analysis of variance with repeated measures?
-The assumptions include the metric scale level of the dependent variable, categorical scale level of the factors, dependent measurements for one factor, independent measurements for the other factor, equal variances in each group, and normal distribution of data within each group.
How can one calculate a two-factor analysis of variance with repeated measures online?
-One can calculate this by visiting a website like datadep.net, entering the data into a table, and using the hypothesis testing feature to select the appropriate test based on the variables.
What does the p-value indicate in the context of hypothesis testing in the video?
-The p-value indicates the probability of observing the data if the null hypothesis is true. If the p-value is less than the significance level (commonly 0.05), the null hypothesis is rejected; if it is greater, the null hypothesis is retained.
What does it mean if there is a significant interaction effect between the two factors in the analysis?
-A significant interaction effect suggests that the effect of one factor on the dependent variable is different at different levels of the other factor, indicating that the factors do not have an independent effect.
How can the summary in words feature on datadep.net assist in interpreting results?
-The summary in words feature provides a plain language interpretation of the results, which can be helpful for those who are not familiar with statistical jargon or who need a quick understanding of the outcome.
Outlines
📊 Introduction to Two-Factor ANOVA with Repeated Measures
This paragraph introduces the concept of two-factor analysis of variance (ANOVA) with repeated measures. It distinguishes between one-factor and two-factor ANOVA and highlights the importance of measurement repetition in the context of two-factor ANOVA. The paragraph explains that this type of ANOVA is used to test for differences across more than two samples categorized by two variables or factors, one of which is a dependent sample. It also contrasts this with single-factor ANOVA with repeated measures, which assesses differences among three or more dependent samples. The paragraph further illustrates the concept with an example of measuring blood pressure at different therapy stages, emphasizing the need for this type of ANOVA when investigating the effects of different therapies over time.
📘 Hypotheses and Assumptions in Two-Factor ANOVA with Repeated Measures
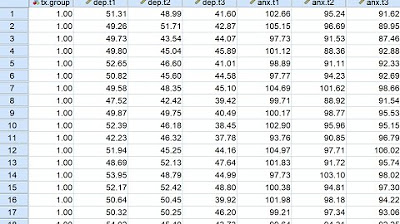
This paragraph delves into the hypotheses tested in a two-factor ANOVA with repeated measures, outlining three null hypotheses and their corresponding alternative hypotheses. It discusses the assumptions underlying this statistical method, such as the metric scale level of the dependent variable, the categorical nature of the factors, the dependency of one set of measurements, and the requirement for equal variances and normal distribution within groups. The paragraph also provides an example of how to conduct and interpret the results of a two-factor ANOVA with repeated measures using an online tool, 'datadep.net'. It explains the process of entering data, selecting the appropriate hypothesis test, and interpreting the p-values to determine whether to reject or retain the null hypotheses. The example uses blood pressure measurements across different therapy types and time points to demonstrate the analysis and interpretation of results.
Mindmap
Keywords
💡Two Factor Analysis of Variance
💡Repeated Measures
💡Dependent Sample
💡Interaction Effect
💡Null Hypothesis
💡Alternative Hypothesis
💡Significance Level
💡P-value
💡Descriptive Statistics
💡Data Assumptions
💡DataDep
Highlights
The video discusses two-factor analysis of variance with repeated measures, a statistical method for analyzing data with two variables and measurement repetition.
Distinguishes between one-factor and two-factor analysis of variance, and the difference between with and without measurement repetition.
Explains that two-factor analysis of variance with repeated measures is used to test differences between more than two samples across two variables, with one factor being a dependent sample.
Clarifies the concept of a dependent sample, where the same subject is measured at different times, such as blood pressure readings before, during, and after therapy.
Differentiates between single-factor and two-factor ANOVA with repeated measures, highlighting the inclusion of a dependent sample in the latter.
Outlines the three hypotheses tested in two-factor ANOVA with repeated measures: influence of the first factor, the second factor, and their interaction effect.
Describes the assumptions for two-factor ANOVA with repeated measures, including metric level for the dependent variable and categorical for factors, as well as equal variances and normal distribution.
Provides an example of using two-factor ANOVA with repeated measures to analyze the effect of different therapies on blood pressure over time.
Demonstrates how to calculate two-factor ANOVA with repeated measures using an online tool like datadep.net.
Guides on how to interpret the results of the analysis, including checking the p-values against a significance level to determine if null hypotheses are rejected or retained.
Explains the significance of p-values in determining whether there is a statistically significant difference between groups or over time.
Illustrates how to analyze the interaction effect between two factors, such as different therapies and time points, using the last hypothesis test.
Shows the importance of understanding the mean values over time points, even when individual therapies might show different trends.
Conveys that a non-significant interaction effect indicates that the therapies do not significantly differ in their impact over time on average.
Provides a step-by-step guide on how to perform and interpret a two-factor ANOVA with repeated measures analysis using an online platform.
Advises on the use of descriptive statistics and summary interpretations for those unfamiliar with the results of ANOVA.
Encourages viewers to explore the video further for a deeper understanding of two-factor ANOVA with repeated measures.
Transcripts
Browse More Related Video

Two Factor ANOVA [without repeated measures]

One Factor vs. Two Factor ANOVA [One Way vs Two Way]
Two-way repeated measures ANOVA in SPSS: one-within, one-between (March 2020)
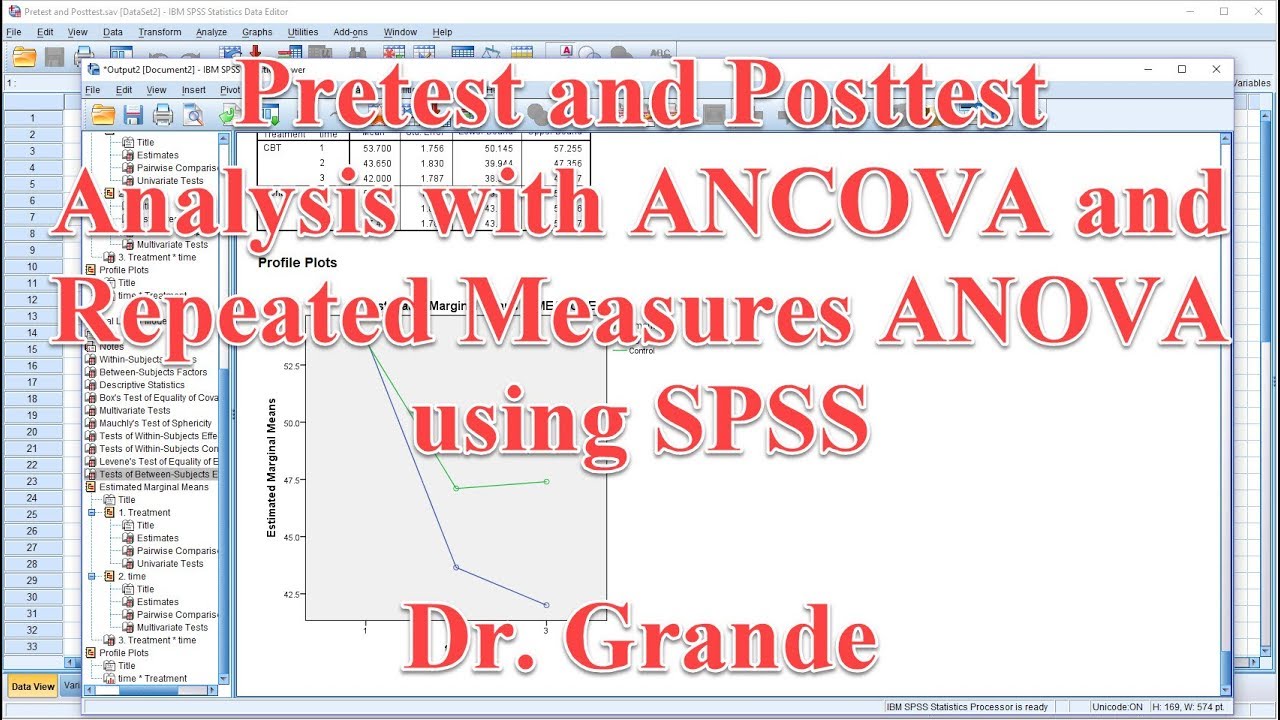
Pretest and Posttest Analysis with ANCOVA and Repeated Measures ANOVA using SPSS

Two-Way ANOVA - Full Course

ANOVA (Analysis of variance) simply explained
5.0 / 5 (0 votes)
Thanks for rating: