Statistics 101: Two-way ANOVA with Replication, An Introduction
TLDRThis video tutorial offers an in-depth introduction to two-way ANOVA with replication, a statistical method for analyzing the interaction between two factors. The instructor uses a plant food research example to illustrate the concept, guiding viewers through the process step-by-step. Key topics include setting up the experiment, calculating means and variances, and interpreting the results using both SPSS and Excel. The video emphasizes the importance of understanding interactions and the significance of the interaction term in ANOVA analysis.
Takeaways
- 😀 Stay positive and keep faith in your ability to overcome challenges in learning statistics.
- 📚 The video series is designed for individuals new to statistics, covering basic concepts in a slow and deliberate manner.
- 🔍 The instructor emphasizes the importance of understanding not just 'what' is happening in statistics, but also 'why' and 'how' to apply it.
- 🌱 The 'Plant Food Research' example is used to illustrate the application of two-way ANOVA with replication in a real-world context.
- 📈 Two-way ANOVA with replication allows for the analysis of interaction effects between two factors, which is not possible with one-way ANOVA.
- 📊 The significance of the interaction effect is highlighted, where the effect of one factor varies depending on the level of the other factor.
- 📝 The video script provides a step-by-step guide on how to conduct a two-way ANOVA with replication using SPSS and Excel.
- 📉 The concept of 'marginal means' is introduced as a way to visualize and interpret the data in a two-way ANOVA.
- 🤔 The importance of looking for significant interaction terms first in ANOVA output is stressed, as it affects the interpretation of main effects.
- 📚 The video aims to give viewers a fundamental understanding of two-way ANOVA, setting a foundation for further learning.
- 🔗 The script encourages viewers to connect with the instructor on social media and provide feedback to improve future content.
Q & A
What is the main topic of the video?
-The main topic of the video is the concept and application of two-way ANOVA with replication, also known as two-factor ANOVA.
Why is it important to stay positive when struggling with statistics according to the instructor?
-The instructor emphasizes staying positive because struggling indicates that the viewer has already accomplished a lot, and with hard work, practice, and patience, they can overcome their current challenges.
What are the different ways the instructor suggests to stay connected with the viewers?
-The instructor suggests following on YouTube, Twitter, Google Plus, or LinkedIn to stay updated with new video uploads and to connect with the viewers online.
How does the instructor encourage viewer engagement with the video?
-The instructor encourages viewers to give the video a thumbs up, share it with classmates or colleagues, or add it to a playlist, and to leave constructive comments for improvement.
What is a one-way ANOVA, and how does it differ from a two-way ANOVA with replication?
-A one-way ANOVA is used to analyze the means of more than two groups to determine if there are any significant differences among them. A two-way ANOVA with replication, on the other hand, includes multiple measurements per cell and allows for the analysis of the interaction between two factors.
What is the significance of the F-statistic in ANOVA?
-The F-statistic in ANOVA is used to test the null hypothesis that there is no difference among group means. A low F-statistic with a corresponding high P-value (greater than .05) indicates that the differences are not statistically significant.
What does the instructor mean by 'interaction' in the context of two-way ANOVA?
-In the context of two-way ANOVA, 'interaction' refers to the effect where the impact of one factor changes depending on the level of the other factor, indicating that the factors are not independent.
How does the instructor use real-world examples to explain the concept of two-way ANOVA?
-The instructor uses a real-world example of plant food research to illustrate the concept of two-way ANOVA, where different types of plant food and feeding frequencies are tested for their impact on plant growth.
What is the importance of plotting cell means on a graph in the context of two-way ANOVA?
-Plotting cell means on a graph helps visualize the data and identify patterns such as interactions between factors. It can show whether the lines representing different levels of one factor cross or are non-parallel, indicating a potential interaction.
How does the instructor demonstrate the process of conducting a two-way ANOVA using Excel?
-The instructor demonstrates the process by showing how to set up the data in Excel, using the data analysis tool for two-factor ANOVA with replication, and interpreting the resulting P-values and F-ratios.
What is the significance of a significant interaction term in the ANOVA output?
-A significant interaction term indicates that the effect of one factor on the dependent variable changes depending on the level of the other factor. If the interaction is significant, the main effects cannot be analyzed separately as the factors are too intertwined.
Outlines
📚 Introduction to Basic Statistics Series
The instructor begins with a motivational message for students struggling with statistics, emphasizing the importance of positivity and perseverance. They encourage following on various social media platforms for updates and suggest that viewers who like the content should engage by liking, sharing, or providing constructive feedback. The video series aims to cover basic statistical concepts, including a detailed look at two-way ANOVA with replication, using graphics and examples for clarity. The first part of the video focuses on conceptual understanding, and the instructor warns that the topic may be challenging, requiring patience and determination.
🌱 Plant Food Research Experiment Overview
The script introduces a hypothetical experiment examining the effectiveness of three different cotton plant foods: Awesome Advantage (AA), Big Buds (BB), and Copious Cotton (CC). The experiment involves testing each plant food with one feeding per day for 75 days, using eight plants for each combination, and measuring the resulting plant height. The results from this experiment are presented, showing the mean height for each plant food type, and a one-way ANOVA is conducted to determine if there are significant differences in plant growth among the different foods. The findings indicate no significant difference, suggesting that the choice of plant food may not be determined by growth alone.
📊 Analyzing Plant Growth with Two-Way ANOVA
The instructor expands the experiment to include two feedings per day, introducing a second factor—feeding frequency—into the analysis. The data from this modified experiment is presented, showing the mean and variance for each cell in the study. The concept of interaction between two factors is introduced, and the instructor explains the importance of understanding how each cell's mean and variance contributes to the overall analysis. The script also includes a detailed explanation of how to interpret the means and variances in the context of a two-way ANOVA with replication.
📈 Visualizing Data with Marginal Means Graphs
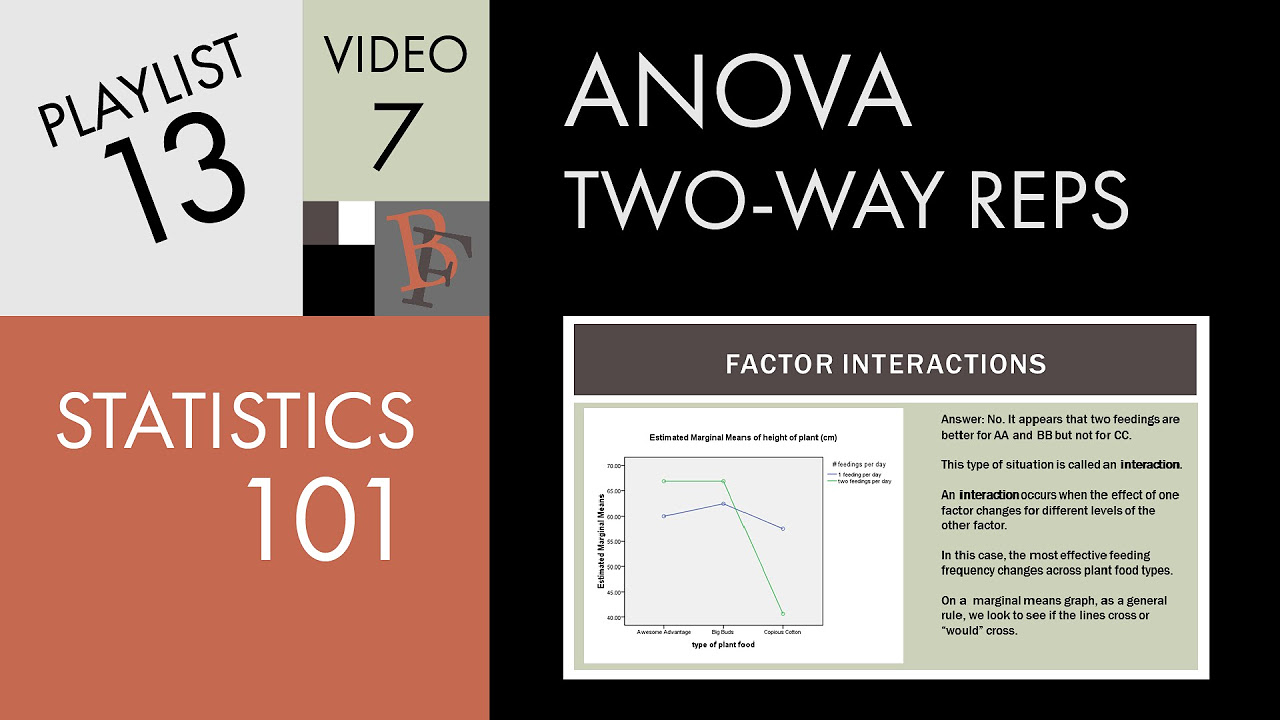
The script discusses the importance of visualizing data through marginal means graphs, explaining how to plot the means for each combination of factors. The instructor uses the plant growth data to demonstrate how to create these graphs and interpret the results, including identifying potential interactions between factors. The concept of interaction is further explained, noting that it occurs when the effect of one factor changes depending on the level of the other factor, as seen in the different responses of plant foods to one versus two feedings per day.
🔍 Deep Dive into Two-Way ANOVA SPSS Output
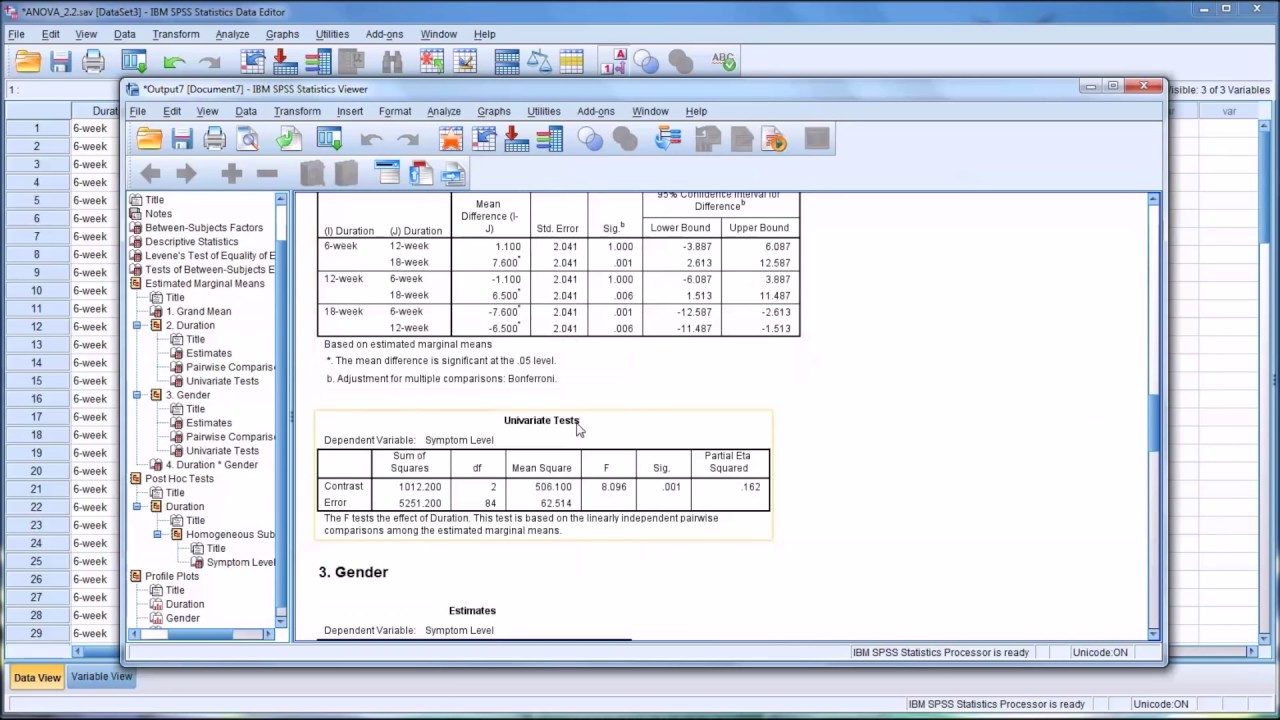
The instructor presents the output from a two-way ANOVA conducted in SPSS, focusing on the significance levels of the feeding frequency, plant food type, and their interaction. The output is analyzed to determine the significance of each factor and the interaction between them. The script emphasizes the importance of looking for a significant interaction first, as it takes precedence over the main effects when interpreting the results of a two-way ANOVA.
🛠️ Conducting Two-Way ANOVA in Excel
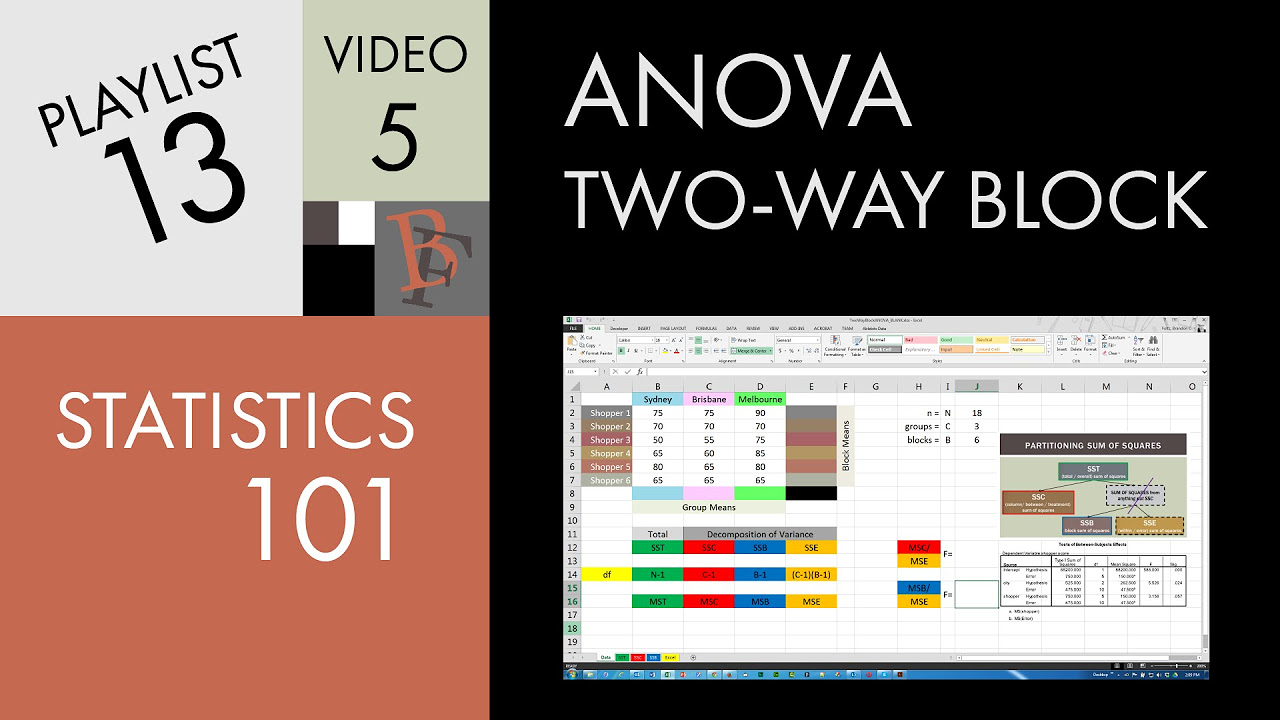
The script provides a step-by-step guide on how to set up and conduct a two-way ANOVA with replication in Excel. The instructor explains the data setup, the process of selecting the correct data analysis tool in Excel, and how to interpret the results. The output from Excel is compared to the SPSS output, demonstrating the consistency between the two software packages in terms of F-ratios and P-values.
📘 Conclusion and Key Takeaways on Two-Way ANOVA
The instructor concludes the video with key takeaways about two-way ANOVA with replication, emphasizing the importance of a balanced design, the significance of means and variances at each level, and the utility of marginal means graphs for visualization. The script advises to always look for significant interactions first in ANOVA output and reminds viewers that if an interaction is significant, the main effects cannot be analyzed separately. The video ends with a look forward to the next video in the series.
Mindmap
Keywords
💡Basic Statistics
💡ANOVA (Analysis of Variance)
💡Replication
💡Factor
💡Interaction
💡Significance Level
💡Null Hypothesis
💡Marginal Means
💡Excel and SPSS
💡Balanced Design
Highlights
The video provides encouragement and reassurance for those struggling with statistics, emphasizing the importance of positivity and perseverance.
The instructor suggests following on social media platforms for updates on new video content, advocating the value of connecting with a broad audience.
The video encourages viewer interaction by asking for likes, shares, and constructive comments to improve future content.
The video is tailored for beginners in statistics, focusing on basic concepts of ANOVA explained in a slow and deliberate manner.
A real-world example of plant food research is introduced to contextualize the application of two-way ANOVA with replication.
The experiment design involves testing three types of cotton plant foods with varying feeding frequencies to measure plant height.
A one-way ANOVA analysis reveals no significant difference in plant growth among the three types of plant food with one feeding per day.
The concept of interaction in two-way ANOVA is introduced, where the effect of one factor varies with different levels of another factor.
The video uses graphics and charts to illustrate the abstract concepts of two-way ANOVA, enhancing understanding through visual learning.
A comprehensive explanation of how to interpret the results of a two-way ANOVA with replication, including the significance of F-ratios and P-values.
The importance of patience and determination when learning complex statistical topics such as two-way ANOVA is highlighted.
A step-by-step guide on how to perform a two-way ANOVA with replication using Excel, from data setup to analysis interpretation.
A comparison of ANOVA results from both SPSS and Excel, demonstrating the consistency of outcomes across different statistical software.
The significance of a balanced design in two-way ANOVA, where each factor combination has an equal number of measurements.
The use of marginal means graphs to visualize data and identify potential interactions between factors.
The video concludes with key takeaways, emphasizing the importance of understanding interactions and the application of two-way ANOVA in real-world scenarios.
Transcripts
Browse More Related Video
Statistics 101: Two-way ANOVA w/o Replication, The Calculation
Conducting a Two-Way ANOVA in SPSS

SPSS (9): Mean Comparison Tests | T-tests, ANOVA & Post-Hoc tests

Two-Way ANOVA - Full Course
Statistics 101: Two-way ANOVA with Replication, Interactions
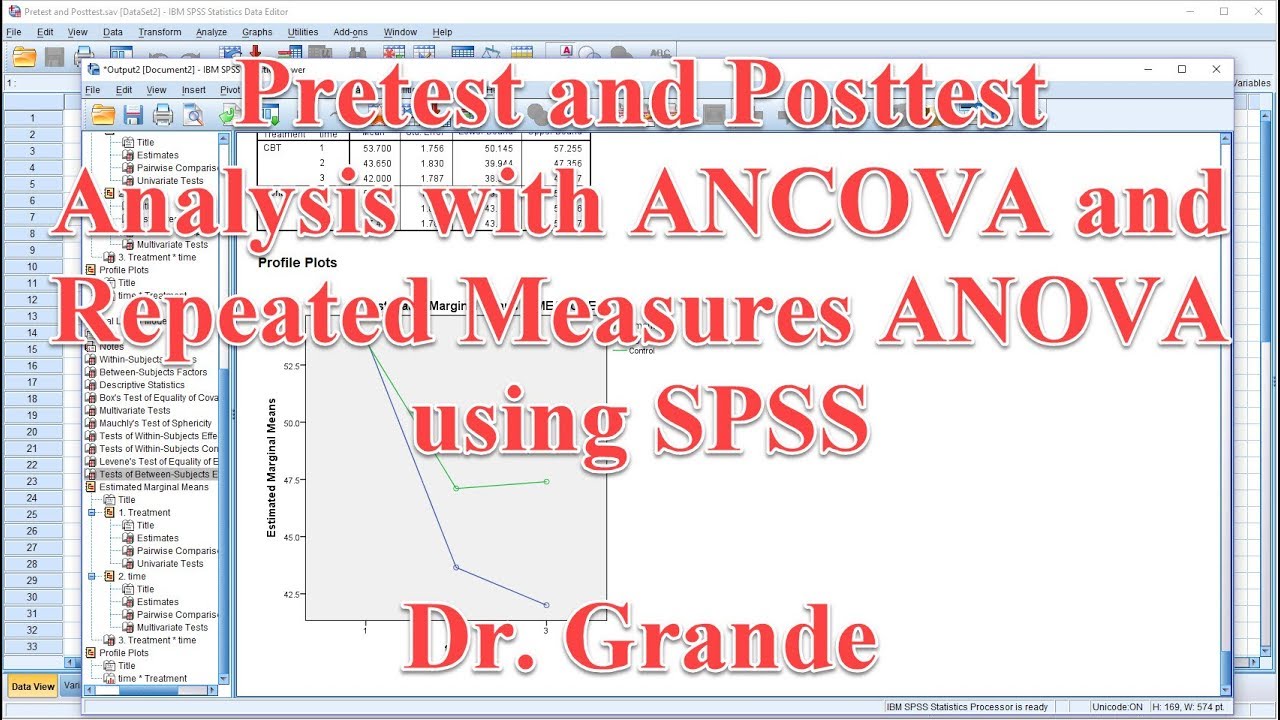
Pretest and Posttest Analysis with ANCOVA and Repeated Measures ANOVA using SPSS
5.0 / 5 (0 votes)
Thanks for rating: