Physics 2.4 - Converting Position and Velocity Time Graphs
TLDRIn this educational podcast, Mr. Hart explains the process of converting between position-time and velocity-time graphs. He emphasizes the importance of understanding the relationship between these two types of graphs and provides clear rules for transitioning between them. By using the slope of the position graph for velocity and the area under the velocity graph for position, students can better analyze and interpret motion data. The podcast includes detailed examples and encourages hands-on practice to solidify the concepts.
Takeaways
- 📈 To convert a position-time graph to a velocity-time graph, calculate the slope of each segment of the position graph.
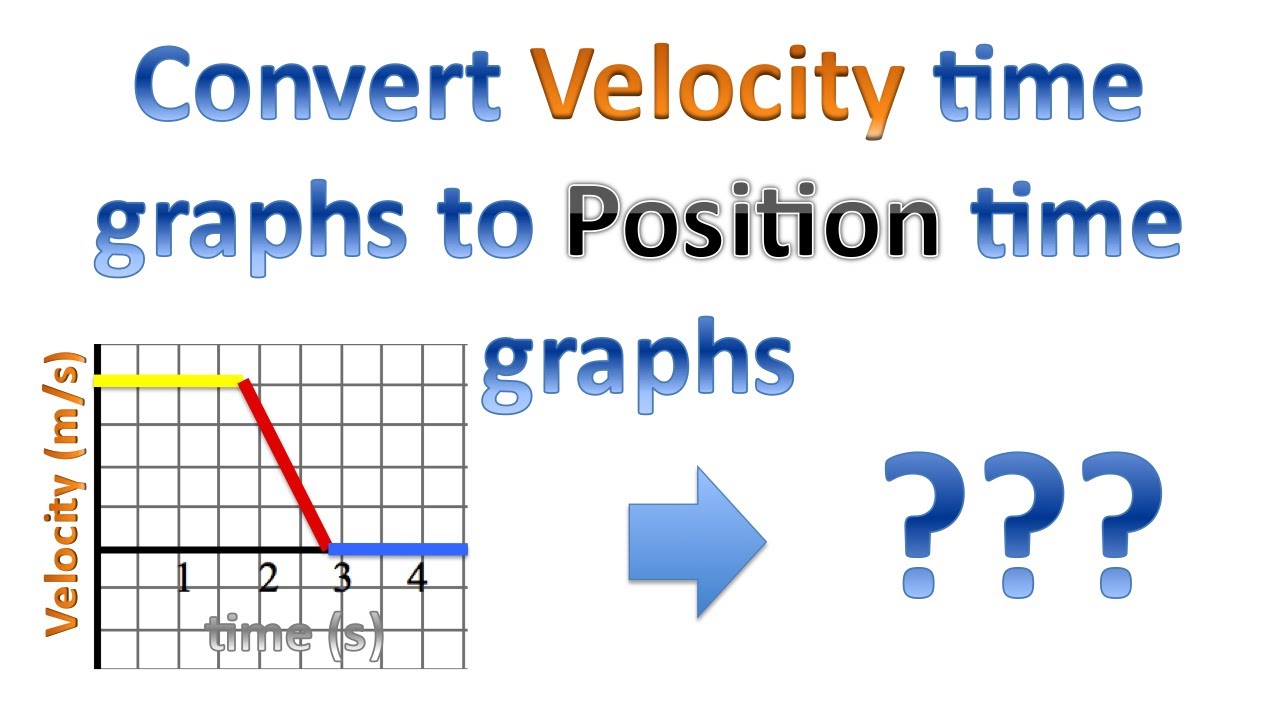
- 📊 When moving from a velocity-time graph to a position-time graph, determine the area under each segment of the velocity graph.
- 🔄 The general principle for graph conversion is to use the slope for velocity-to-position and area for position-to-velocity.
- 🛠️ For a position graph segment where the object moves 5 meters in 5 seconds, the velocity graph slope is 1 meter per second.
- ⏱️ A stationary object in the position graph corresponds to a velocity graph slope of 0 meters per second.
- 📉 If an object moves backward in the position graph, the slope in the velocity graph will be negative.
- 📈 For a velocity graph with a constant velocity, the area under the rectangle represents the distance covered.
- 🔽 A zero area in a velocity graph indicates the object is not moving during that time interval.
- 🔄 When converting, remember that negative areas in a velocity graph represent movement in the opposite direction.
- 📚 The homework involves practicing the conversion between position-time and velocity-time graphs using the principles of slope and area.
- ⚠️ Be cautious to correctly identify whether you are converting from position to velocity or vice versa to avoid errors.
Q & A
What is the main topic of the podcast?
-The main topic of the podcast is how to convert between position-time graphs and velocity-time graphs.
What is the general principle for switching between position-time and velocity-time graphs?
-The general principle is that when converting from a position-time graph to a velocity-time graph, you take the slope of each part of the position graph. Conversely, when converting from a velocity-time graph to a position-time graph, you take the area under each part of the velocity graph.
How is the slope of a position-time graph calculated?
-The slope of a position-time graph is calculated as the rise over the run, which represents the change in position (rise) divided by the change in time (run).
What does the slope of zero meters per second represent in the context of the podcast?
-A slope of zero meters per second represents a situation where the object is sitting still or not moving during that time interval.
How is the area under a velocity-time graph used to determine the position-time graph?
-The area under each part of a velocity-time graph is used to determine the position at different times by summing up these areas vertically, which gives the total displacement at each time point.
What happens when a velocity-time graph has a negative area?
-A negative area in a velocity-time graph indicates that the object is moving in the opposite direction, not that the area is literally negative, but rather that the movement is in the negative direction (e.g., moving backward).
How does the shape of the velocity-time graph affect the position-time graph?
-The shape of the velocity-time graph, including slopes and slants (triangles), determines the position changes in the position-time graph. Areas under rectangles and triangles are calculated to determine the cumulative position at different times.
What is the significance of the slope in the velocity-time graph for the first 5 seconds in the example given?
-The slope of 1 meter per second in the velocity-time graph for the first 5 seconds indicates a constant velocity where the object moves forward by 1 meter for each second that passes.
In the example provided, what is the slope of the velocity-time graph for the last 20 seconds?
-The slope of the velocity-time graph for the last 20 seconds is 2 meters per second, indicating the object moves forward at a rate of 2 meters for each second in that time interval.
How can you convert a complex velocity-time graph with slopes into a position-time graph?
-To convert a complex velocity-time graph with slopes into a position-time graph, you break the graph into parts (rectangles and triangles), calculate the area or half the area for triangles, and then sum these areas at each corresponding time interval to determine the position.
What is the homework assignment based on the podcast?
-The homework assignment involves taking the provided graphs and converting between position-time and velocity-time graphs, remembering to use slopes for the former and areas for the latter.
Outlines
📈 Converting Position-Time to Velocity-Time Graphs
This paragraph introduces the concept of converting between position-time and velocity-time graphs. Mr. Hart explains the general principle for switching between these two types of graphs. The key rule is that when moving from a position graph to a velocity graph, one takes the slope of each part of the position graph. Conversely, when moving from a velocity graph to a position graph, one takes the area under each part of the velocity graph. The paragraph provides a detailed example of converting a given position-time graph to a velocity-time graph by calculating the slope at different points and plotting the corresponding velocity graph.
📊 Understanding Velocity-Time Graphs and Calculating Position-Time Graphs
In this paragraph, the focus shifts to understanding how to convert velocity-time graphs to position-time graphs. The method involves using the area under each part of the velocity-time graph to determine the position at different times. The paragraph provides a step-by-step example of calculating the areas of different shapes (rectangles and triangles) in the velocity-time graph and translating these into positions on the position-time graph. It emphasizes the importance of correctly identifying the shapes and their areas to accurately plot the position-time graph.
🎓 Homework Assignment: Graph Conversion Practice
The final paragraph outlines the homework assignment for the viewers, which involves practicing the conversion between position-time and velocity-time graphs. It reiterates the key principles for both conversions: taking slopes for velocity-time from position-time graphs and calculating areas for position-time from velocity-time graphs. The paragraph also hints at the inclusion of more complex graph elements, such as slopes and slants, in the homework, encouraging viewers to break down the graphs into more parts for accurate conversion.
Mindmap
Keywords
💡Position Time Graph
💡Velocity Time Graph
💡Slope
💡Area
💡Conversion
💡Displacement
💡Acceleration
💡Static
💡Deceleration
💡Mathematical Relationship
Highlights
The podcast focuses on converting between position-time and velocity-time graphs.
The general principle for switching between these graphs is based on taking the slope of the position graph for velocity and the area under the velocity graph for position.
When converting a position-time graph to a velocity-time graph, the slope at each part of the position graph is taken.
An example is provided where an object moves forward, sits still, and then moves backward, with corresponding slopes calculated for each phase.
The velocity-time graph is plotted by taking the slope at each individual part of the position graph and plotting it accordingly.
For converting a velocity-time graph to a position-time graph, the area under each part of the velocity graph is taken.
The area under the velocity graph segments is used to determine the position at each point in time.
An example is given where different segments of the velocity graph (rectangles and triangles) are used to calculate areas and plot the corresponding position-time graph.
Negative areas in the position graph indicate movement in the opposite direction.
The process of converting graphs is demonstrated with a detailed example, including calculating slopes and areas.
The importance of understanding the direction of movement (forward or backward) when dealing with negative areas is emphasized.
The podcast concludes with a reminder that the homework will involve converting between position-time and velocity-time graphs.
The key takeaway is to know whether to take the slope or the area when converting graphs, and to be careful not to confuse the two.
The method for dealing with slanted lines (triangles) in velocity-time graphs is explained, where the area is calculated as one half the base times the height.
The podcast provides a comprehensive guide for students to understand and practice graph conversion between position-time and velocity-time representations.
Transcripts
Browse More Related Video

Velocity Time Graphs, Acceleration & Position Time Graphs - Physics
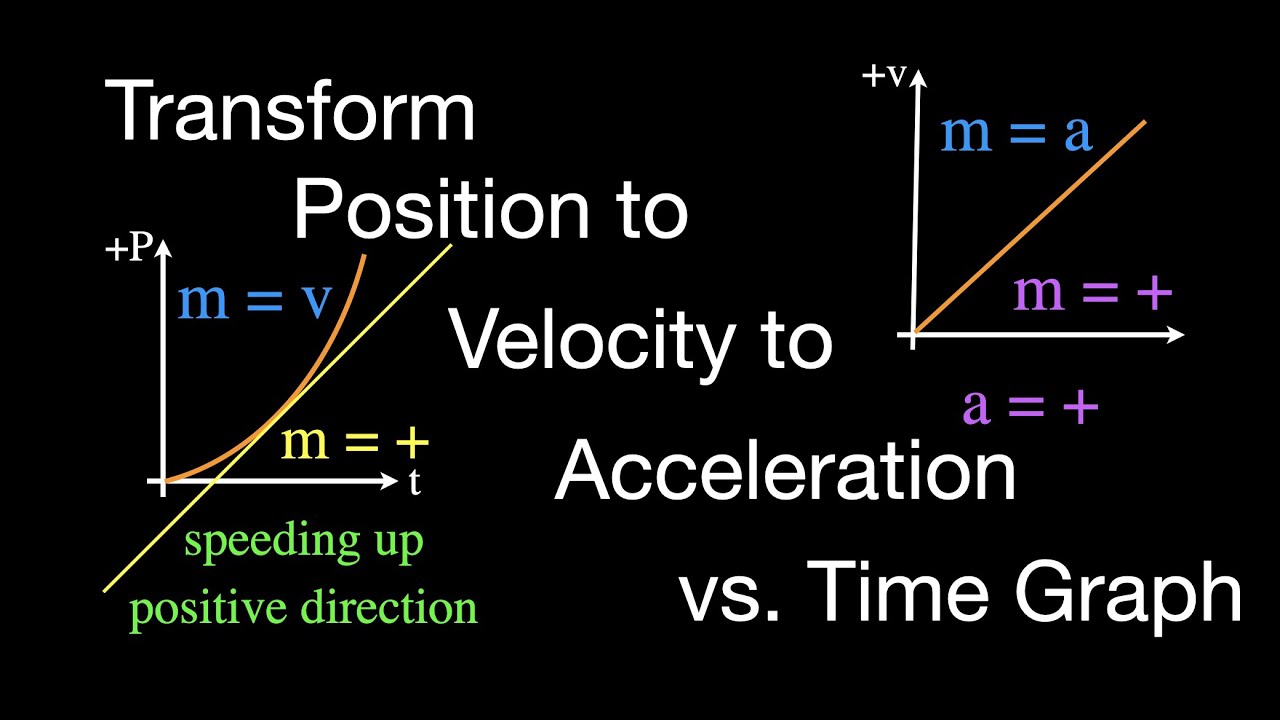
Motion Graphs: Transforming Position to Velocity to Acceleration vs Time
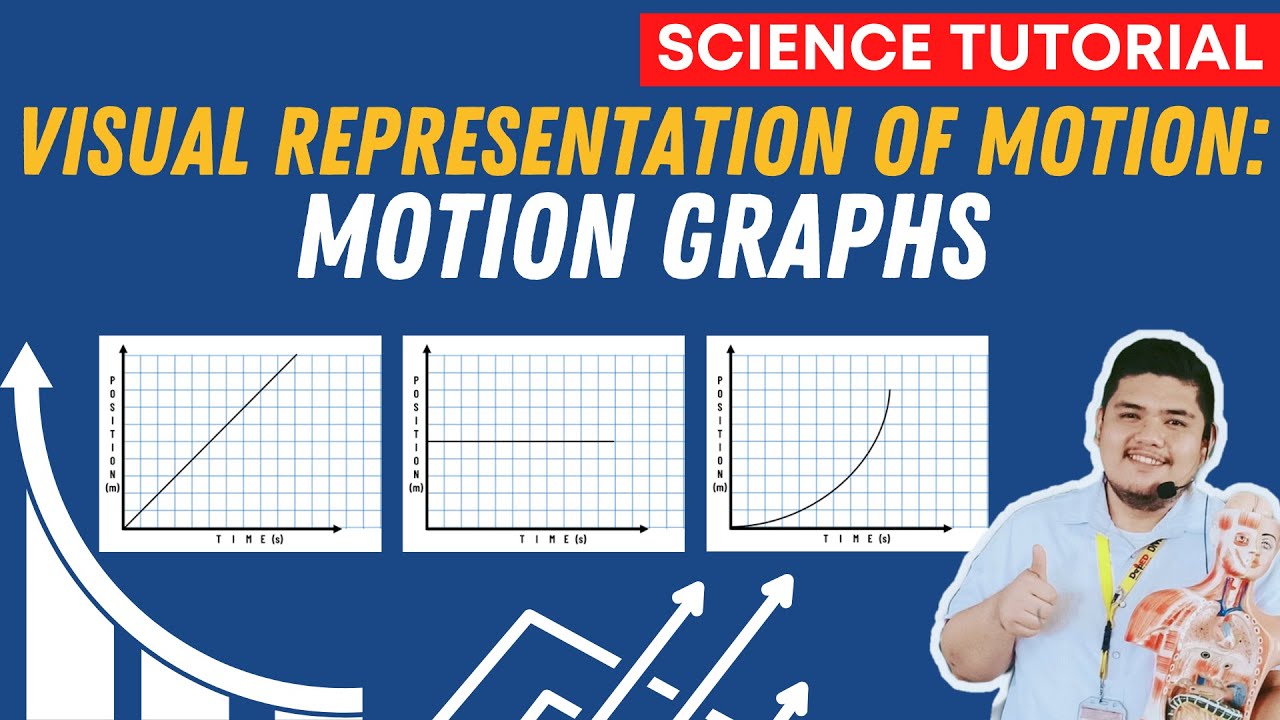
Visualizing Motion Using Tape Charts and Motion Graphs | SCIENCE 7 QUARTER 3 MODULE 2 WEEK 3
Position vs. Time Graph - Part 1
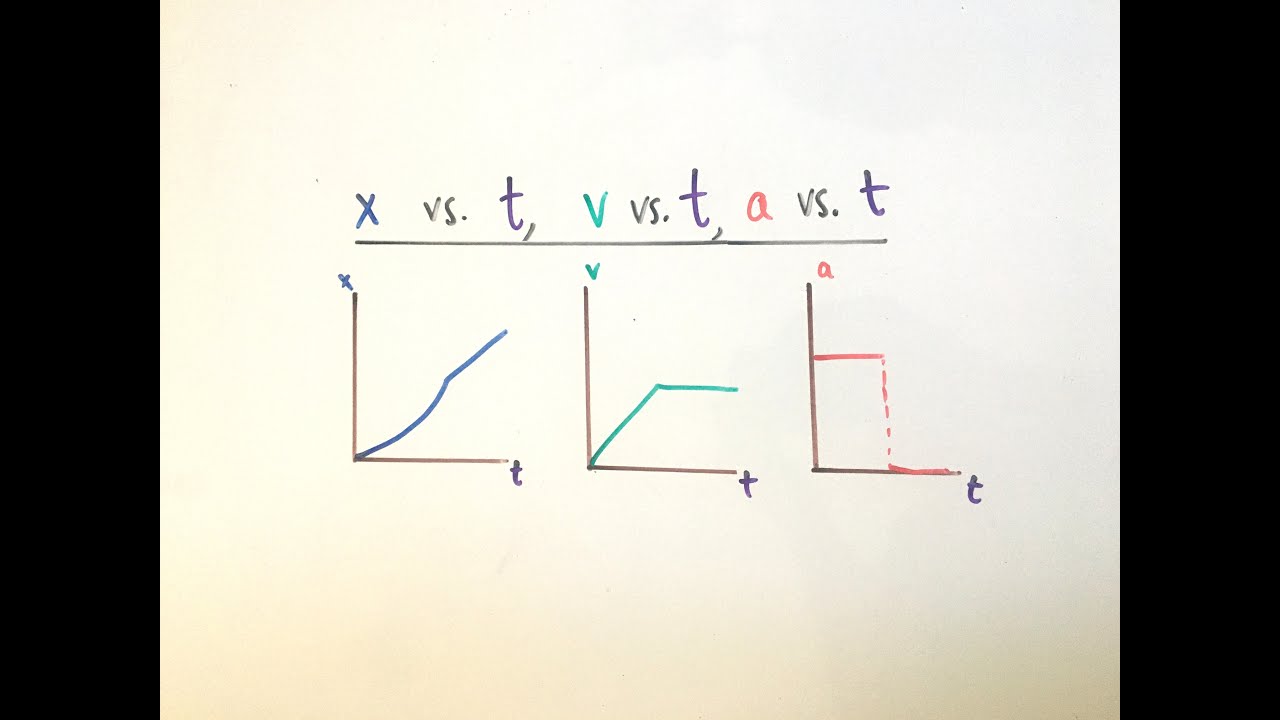
Position/Velocity/Acceleration vs. Time Graphs (AP Physics 1)
Velocity time graph conversion to Position time graph
5.0 / 5 (0 votes)
Thanks for rating: