Pretest and Posttest Analysis with ANCOVA and Repeated Measures ANOVA using SPSS
TLDRDr. Grande's video tutorial offers a step-by-step guide on analyzing pretest and posttest data using SPSS. The video covers two methods: Analysis of Covariance (ANCOVA) and Repeated Measures ANOVA. It explains the assumptions required for each test, such as normality, homogeneity of variance, and linearity of the covariate with the dependent variable. The tutorial demonstrates how to set up and interpret the statistical tests in SPSS, including checking for significance and effect size. The example uses fictitious data with a treatment variable and dependent variables for depression levels measured at different times. The video concludes with advice on interpreting results when assumptions are violated, ensuring viewers can effectively analyze their own pretest and posttest data.
Takeaways
- 📚 The video is a tutorial on analyzing pretest and posttest results using SPSS, presented by Dr. Grande.
- 🔍 The example data involves a treatment variable with two levels (CBT and control group) and dependent variables (pretest, posttest, and post-test three months).
- 📈 Two main statistical techniques are demonstrated: Analysis of Covariance (ANCOVA) and Repeated Measures ANOVA.
- 🧐 ANCOVA is used to determine if there is a difference in post-test means by group after adjusting for pretest observations, with the pretest serving as the covariate.
- 📝 Several assumptions must be met before conducting ANCOVA, including independence of observations, normal distribution of variables, homogeneity of variance, and linear relationship between the covariate and the dependent variable.
- 📊 The video shows how to conduct ANCOVA in SPSS by using the 'General Linear Model' and 'Univariate' options.
- 📉 Repeated Measures ANOVA considers both between-subjects factors (like treatment) and within-subjects factors (like time between pretest and posttest).
- 🔍 Repeated Measures ANOVA can accommodate more than two within-subjects factors, unlike ANCOVA which is limited to two.
- 📚 The video explains how to perform Repeated Measures ANOVA in SPSS, including setting up within-subjects factors and between-subjects factors.
- 🔎 Assumptions for Repeated Measures ANOVA include continuous measurement of dependent variables, normal distribution, and homogeneity of variance.
- 📊 The video includes an example of how to interpret the output of Repeated Measures ANOVA, including tests for sphericity and the significance of within- and between-subjects effects.
Q & A
What is the purpose of the video presented by Dr. Grande?
-The purpose of the video is to demonstrate how to analyze pretest and posttest data using SPSS, focusing on two statistical techniques: Analysis of Covariance (ANCOVA) and Repeated Measures ANOVA.
What are the two levels of the independent variable 'treatment' mentioned in the video?
-The two levels of the independent variable 'treatment' are cognitive behavioral therapy (CBT) and a control group, represented by the values 0 and 1, respectively.
What statistical assumptions are necessary before conducting an ANCOVA?
-Before conducting an ANCOVA, one must ensure the independence of observations, the independent variable has two or more categorical groups, the dependent variable and covariant are continuous, and check for outliers, homogeneity of variance, homogeneity of regression slopes, and a linear relationship between the covariant and the dependent variable.
How is the pretest used in the context of ANCOVA in the video?
-In the context of ANCOVA, the pretest serves as the covariant, which is used to adjust for initial differences between groups, allowing the comparison of post-test means after accounting for these initial differences.
What does the video demonstrate about the pretest and posttest scores for the CBT and control groups?
-The video demonstrates that the mean score for the CBT group is lower than the mean score for the control group in the posttest, suggesting a potential treatment effect when analyzed using ANCOVA.
What is the role of the 'time' factor in the Repeated Measures ANOVA presented in the video?
-In the Repeated Measures ANOVA, 'time' is a within-subjects factor, representing the different measurement points (pretest and posttest) at which the dependent variable (depression levels) is assessed.
What are the assumptions that need to be met for a Repeated Measures ANOVA?
-For a Repeated Measures ANOVA, the assumptions include the dependent variables being measured at the continuous level, at least two levels for the between-subjects factor, checking for outliers, normal distribution of dependent variables for each combination of independent variable levels, and homogeneity of variance.
How does the video handle the inclusion of a third dependent variable, 'post-test three months', in the Repeated Measures ANOVA?
-The video includes the third dependent variable by adjusting the number of levels for the within-subjects factor to three (pretest, posttest, and post-test at three months) and re-running the Repeated Measures ANOVA to account for this additional data point.
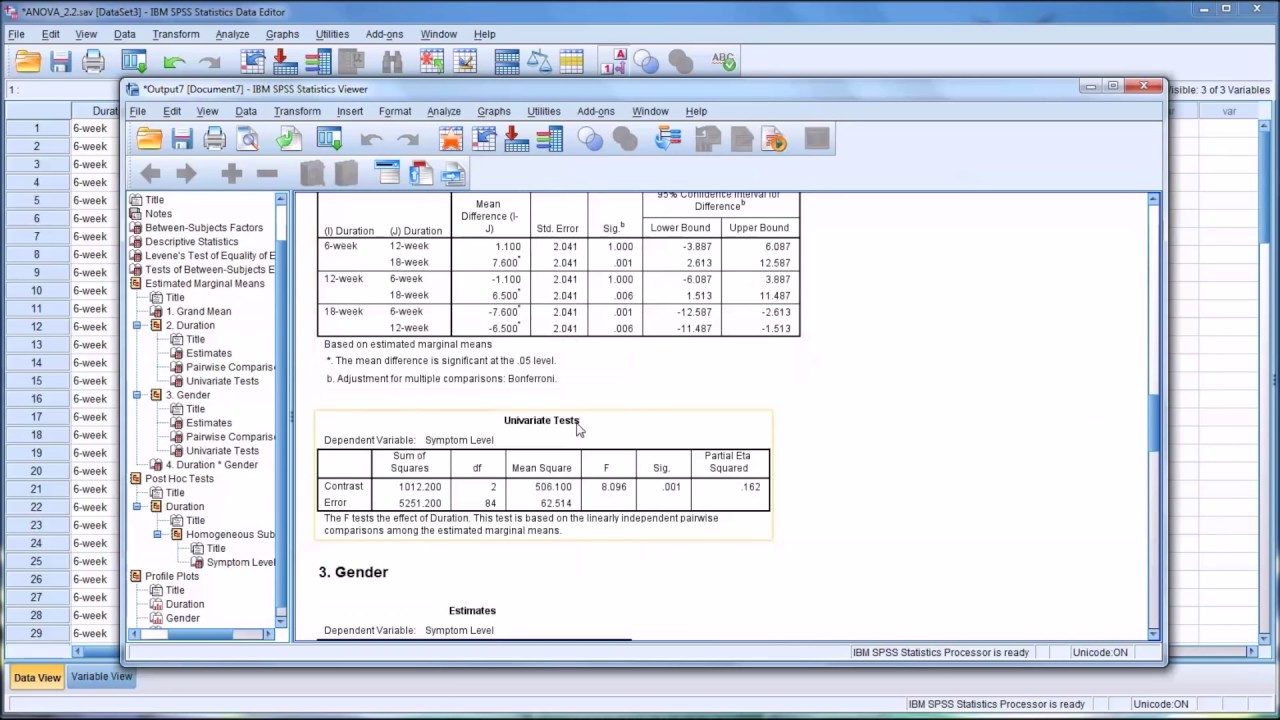
What does the video reveal about the statistical significance of the interaction effect between time and treatment in the Repeated Measures ANOVA?
-The video reveals that the interaction effect between time and treatment is not statistically significant when using the Mauchly's test of sphericity, indicating that the assumption of sphericity was violated and thus the results should be interpreted with caution.
What does the video suggest about the effectiveness of CBT compared to the control group based on the posttest and post-test at three months data?
-The video suggests that the CBT group showed a decrease in depression scores from posttest to post-test at three months, while the control group's scores increased slightly, indicating a potential long-term effect of the CBT intervention.
Outlines
📊 Introduction to Analyzing Pretest and Posttest Data with SPSS
Dr. Grande introduces a video tutorial on analyzing pretest and posttest results using SPSS. The video will demonstrate how to use Analysis of Covariance (ANCOVA) and Repeated Measures ANOVA to assess the impact of a treatment (CBT vs. control) on a dependent variable, such as depression levels. The data presented is fictitious and includes an independent variable with two levels (0 and 1) representing the two groups, and dependent variables for pretest, posttest, and a follow-up three months posttest. The video will not cover all assumptions but will list them, focusing on the analysis process with SPSS.
🧐 Conducting ANCOVA to Compare Treatment Effects
This section explains how to perform Analysis of Covariance (ANCOVA) in SPSS. ANCOVA is used to determine if there is a significant difference in post-test means between groups after adjusting for pretest scores. The pretest serves as the covariate in this analysis. The video demonstrates the steps to set up an ANCOVA in SPSS, including selecting the dependent variable (post-test), the fixed factor (treatment), and the covariate (pretest). Descriptive statistics and tests for homogeneity of variance are discussed, with the results indicating no significant difference between the CBT and control groups based on the p-value obtained from the analysis.
🔍 Setting Up Repeated Measures ANOVA in SPSS
The video script moves on to setting up a Repeated Measures ANOVA in SPSS, which accounts for both between-subjects factors (like treatment) and within-subjects factors (such as time). The process involves defining the number of levels for the within-subject factor, which in this case is two levels (pretest and posttest). The script explains how to add variables to the analysis, set up plots, and choose options for displaying means, effect size, and homogeneity tests. The aim is to check for significant effects of time, treatment, and their interaction on the dependent variable.
📈 Analyzing Results of Repeated Measures ANOVA
The results of the Repeated Measures ANOVA are analyzed, focusing on the significance of time and the interaction between time and treatment. The video discusses the importance of checking for sphericity assumption using Mauchly's test and interprets the results using different statistical corrections when assumptions are violated. Descriptive statistics show similar pretest scores but differing posttest scores between the CBT and control groups. The script also covers the process of adding a third dependent variable, the post-test at three months, to the analysis.
📉 Conclusion and Final Analysis with Three Dependent Variables
In the final part of the video script, Dr. Grande includes the third dependent variable in the Repeated Measures ANOVA to analyze the data with all three time points: pretest, posttest, and post-test at three months. The script details the steps to configure the analysis in SPSS and interprets the results, noting the violation of sphericity and the implications for the interpretation of the interaction effect. The descriptive statistics and profile plot illustrate the changes in scores over time for both the CBT and control groups. The video concludes with a summary of the findings and a thank you to the viewers.
Mindmap
Keywords
💡ANOVA
💡Covariance Analysis (ANCOVA)
💡Repeated Measures ANOVA
💡Between-Subjects Factor
💡Within-Subjects Factor
💡Treatment Variable
💡Dependent Variable
💡Cognitive Behavioral Therapy (CBT)
💡Homogeneity of Variance
💡Sphericity
💡Assumptions
Highlights
Introduction to a video tutorial by Dr. Grande on analyzing pretest and posttest results using SPSS.
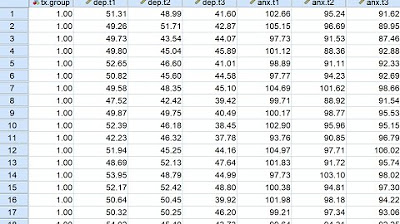
Use of fictitious data for demonstration purposes within SPSS data editor.
Explanation of an independent variable 'treatment' with two levels: 0 (control group) and 1 (CBT group).
Discussion on dependent variables: pretest, post-test, and post-test three months.
Introduction of two statistical methods: ANCOVA and repeated measures ANOVA for data analysis.
Assumption of random assignment of participants to CBT or control groups as a between-subjects factor.
Description of pretest and posttest as measures of depression levels with time as a within-subjects factor.
Steps to conduct an ANCOVA in SPSS, including assumptions and the role of the pretest as a covariate.
Assumptions for ANCOVA, such as independence of observations, normality, and homogeneity of variance.
Demonstration of how to input variables into SPSS for ANCOVA and interpretation of results.
Finding of non-significance in the treatment effect on post-test scores using ANCOVA.
Introduction to repeated measures ANOVA, including its consideration of both between and within-subjects factors.
Assumptions for repeated measures ANOVA, including normality and sphericity.
Process of setting up repeated measures ANOVA in SPSS and interpretation of descriptive statistics.
Statistically significant effect of time on depression scores but not the interaction between time and treatment.
Violation of sphericity assumption when adding a third dependent variable (post-test at three months).
Inclusion of post-test at three months in the analysis and its impact on the results.
Final analysis showing no significant difference between CBT and control groups across all three time points.
Conclusion and thanks for watching the tutorial on analyzing pretest and posttest data in SPSS.
Transcripts
Browse More Related Video

5.0 / 5 (0 votes)
Thanks for rating: