Graphs of Motion : Easy and Quick Summary
TLDRThis educational video script introduces viewers to the concept of motion graphs, focusing on position versus time, velocity versus time, and acceleration versus time graphs. It emphasizes the importance of understanding the differences between position and displacement, and how to plot and interpret these graphs to determine an object's motion characteristics, such as constant velocity, acceleration, and deceleration. The script encourages practice and offers a step-by-step guide on how to calculate various aspects of motion, like velocity and displacement, from the graphs, making it an informative resource for students or anyone preparing for a test on kinematics.
Takeaways
- 📈 Understanding graphs of motion is essential for analyzing moving objects, and practice is key to mastering them.
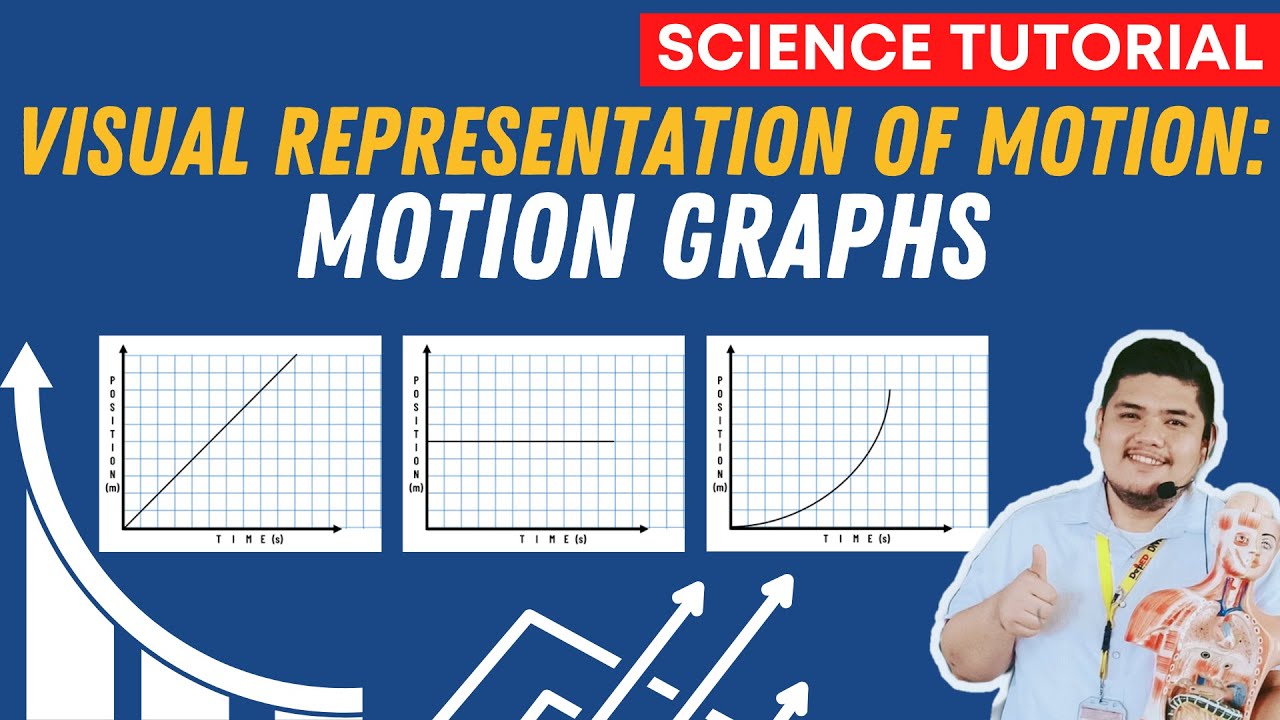
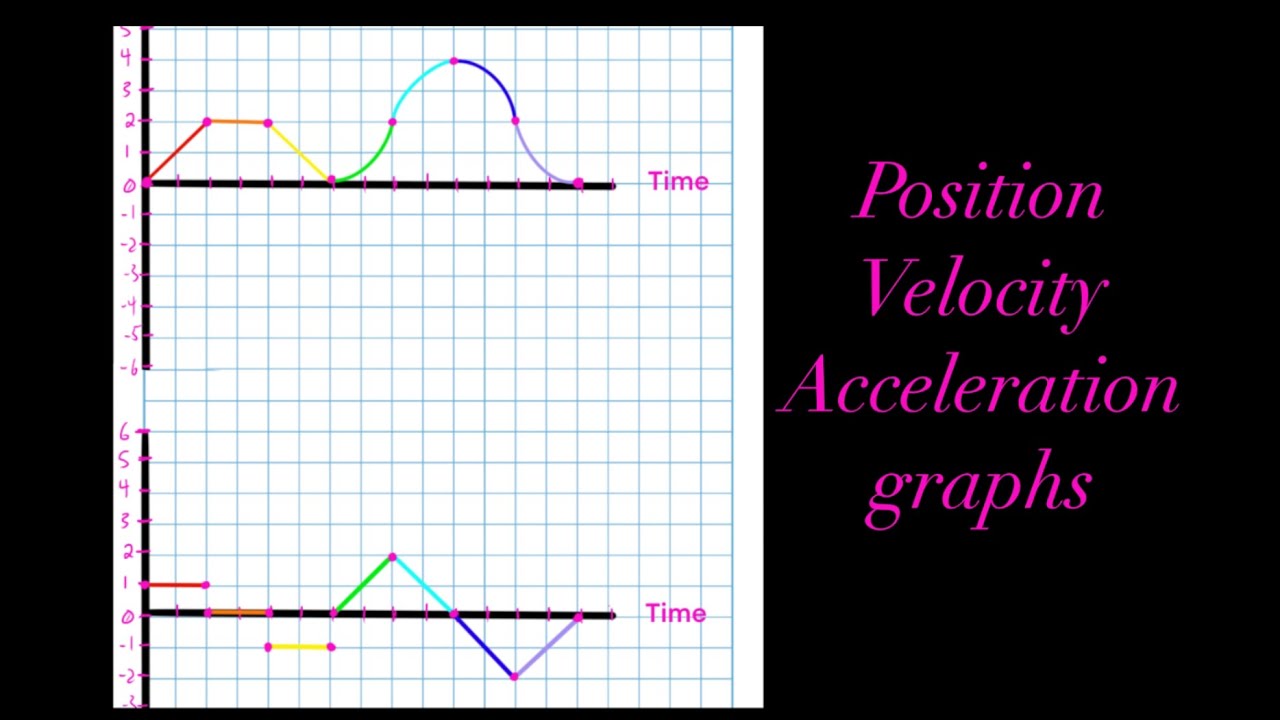
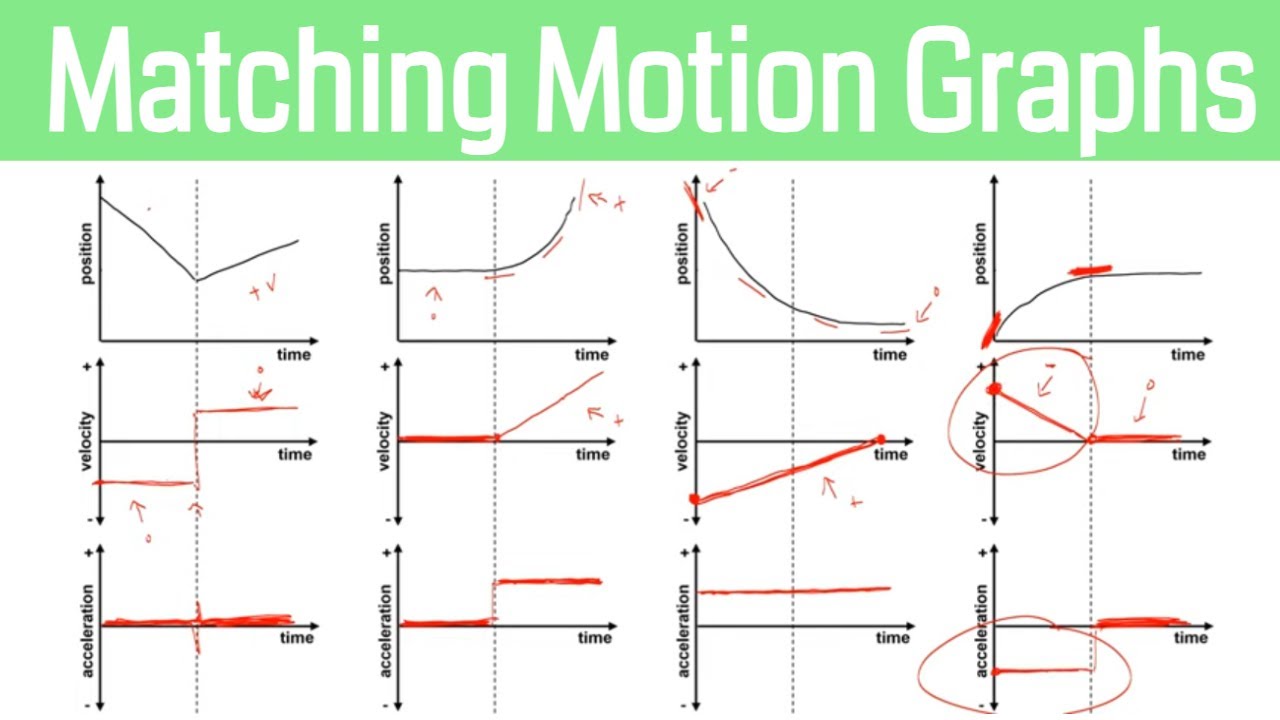
- 📊 There are three main types of motion graphs: position versus time, velocity versus time, and acceleration versus time graphs.
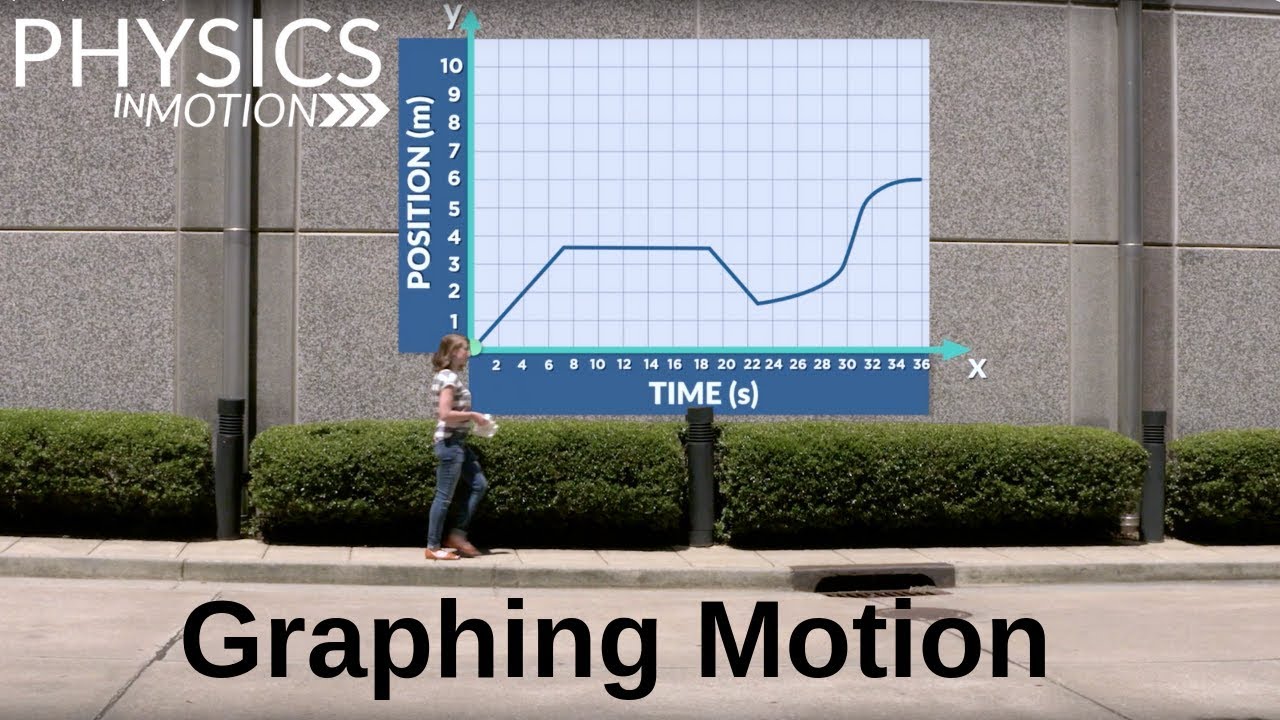
- 📍 Position versus time graphs (displacement graphs) show an object's location at different times, with a straight line indicating constant velocity.
- 🚀 Velocity versus time graphs show how fast an object is moving at different times, with straight lines indicating constant acceleration.
- 🌟 Acceleration versus time graphs are simple, usually horizontal lines that indicate constant acceleration, with positive, negative, or zero values.
- 🔄 The slope of a graph in a velocity-time graph represents the acceleration, with steeper slopes indicating greater velocity.
- 🔢 Calculating displacement from a velocity-time graph involves finding the area under the graph, which can be done by breaking it into shapes and summing their areas.
- 📐 To find acceleration from a velocity-time graph, look at the gradient of the graph at any given time, which indicates the rate of change of velocity.
- 🛑 Negative velocity on a graph indicates that the object has stopped and possibly changed direction.
- 🔄 Understanding the relationship between the slope of a graph and the physical quantities it represents (velocity, acceleration) is crucial for interpreting motion graphs correctly.
- 📈 Graphs of motion are not only for visual interpretation but also for performing calculations related to an object's motion.
Q & A
What is the main topic of the video?
-The main topic of the video is understanding and working with graphs of motion, specifically position versus time, velocity versus time, and acceleration versus time graphs.
How does the video suggest one should approach learning about graphs of motion?
-The video suggests that learners should practice drawing and interpreting graphs of motion by getting a pen and paper and following along with the examples provided in the video.
What is the difference between position and displacement in the context of motion graphs?
-Position refers to the location of an object at a given time, while displacement is the change in position from the starting point to the current location.
What type of graph is used to represent an object moving at a constant velocity?
-A position versus time graph is used to represent an object moving at a constant velocity, which will show as a straight line on the graph.
How can you determine if an object is accelerating from a position versus time graph?
-If the position versus time graph shows a curved line rather than a straight line, it indicates that the object is accelerating, meaning its velocity is changing over time.
What does the slope of a velocity versus time graph represent?
-The slope of a velocity versus time graph represents the acceleration of the object. A steeper slope indicates a higher acceleration, while a flatter slope indicates a lower acceleration or deceleration.
How can you calculate the displacement of an object using a velocity versus time graph?
-To calculate displacement from a velocity versus time graph, you need to find the area under the graph between the relevant time intervals, taking into account the shapes formed (triangles, rectangles, etc.) and their respective areas.
What is the significance of the area under a graph in the context of physics?
-In physics, the area under a graph often has physical significance. For example, the area under a velocity versus time graph represents the displacement of an object, while the area under an acceleration versus time graph can represent the change in velocity.
How can you find the acceleration of an object at a specific time from a velocity versus time graph?
-To find the acceleration of an object at a specific time from a velocity versus time graph, you calculate the gradient (slope) of the graph at that particular time point. The gradient value represents the acceleration in meters per second squared (m/s²) at that instant.
What does a negative velocity indicate in the context of motion?
-A negative velocity indicates that the object has changed its direction of motion. It means the object is moving in the opposite direction to the positive velocity, which could occur, for example, when an object comes to a stop and then moves backward.
What is the relationship between the gradient of a position versus time graph and velocity?
-The gradient (slope) of a position versus time graph represents the velocity of the object at any given time. A constant gradient indicates a constant velocity, while a changing gradient indicates that the velocity is changing, which could be due to acceleration or deceleration.
Outlines
📈 Introduction to Graphs of Motion
The paragraph introduces the concept of graphs of motion, specifically focusing on position versus time graphs. It emphasizes the importance of understanding the difference between position and displacement, and encourages the viewer to practice drawing these graphs rather than just watching the video. The speaker explains that position is the location of an object, while displacement is the change in position. The paragraph concludes with a practical example of plotting a constant velocity on a position-time graph.
📊 Describing Motion Through Graphs
This paragraph delves into the interpretation of position-time and velocity-time graphs. It explains how the rate of increase in displacement over time can indicate the velocity of an object. The speaker uses examples to illustrate how a straight line on a position-time graph indicates constant velocity, while a curve indicates acceleration. The paragraph also introduces the concept of negative velocity, which signifies a change in direction of the object. The speaker provides a detailed breakdown of how to describe the motion of an object based on the graph's slope and curvature.
🚀 Understanding Velocity and Acceleration Graphs
The paragraph focuses on velocity-time (VT) graphs, which are typically straight lines, making them easier to interpret. The speaker guides the viewer through drawing graphs for objects moving at constant, increasing, and decreasing velocities. It explains that a constant velocity is represented by a flat line, an increasing velocity by a line sloping upwards, and a decreasing velocity by a line sloping downwards. The speaker also touches on the concept of negative velocity, indicating a change in direction, and emphasizes the importance of recognizing these patterns on VT graphs.
📈 Calculating Information from Graphs
This section provides a method for calculating information from displacement-time (XT) and velocity-time (VT) graphs. The speaker explains how to use gradients to find velocity from an XT graph and areas under the curve to find displacement from a VT graph. It also introduces the concept of using the area under a VT graph to determine displacement and the gradient of a VT graph to find acceleration. The paragraph concludes with an example calculation of displacement from a VT graph, demonstrating how to sum the areas of different sections of the graph to find the total displacement.
🔢 Advanced Graph Calculations
The final paragraph discusses advanced calculations involving acceleration-time (AT) graphs. It explains how to calculate the acceleration of an object at various times by finding the gradient of the graph. The speaker provides a detailed example of calculating acceleration from a VT graph, highlighting the importance of understanding the direction of acceleration in relation to the direction of motion. The paragraph concludes with a reminder of the significance of being able to calculate acceleration from VT graphs and a call to action for further exploration of acceleration-time graphs in future content.
Mindmap
Keywords
💡Graphs of Motion
💡Position vs. Displacement
💡Constant Velocity
💡Acceleration
💡Velocity-Time (VT) Graphs
💡Calculations from Graphs
💡Negative Velocity
💡Slope
💡Practice
💡Gradient
💡Area Under the Graph
Highlights
Graphs of motion are a powerful tool for understanding the movement of objects.
There are three main types of graphs for motion: position vs. time, velocity vs. time, and acceleration vs. time.
Position vs. time graphs, or displacement graphs, show where an object is at different points in time.
Displacement is the change in position, not the actual position.
An object moving at a constant velocity will create a straight line on the position vs. time graph.
If the position vs. time graph is curved, it indicates acceleration or changing velocity.
Velocity vs. time graphs are typically straight lines, making them simpler to interpret.
A straight line in a velocity vs. time graph indicates constant velocity.
An object with increasing velocity will show a line with a positive slope on the velocity vs. time graph.
A decreasing velocity is represented by a line with a negative slope in the velocity vs. time graph.
Acceleration vs. time graphs are either horizontal lines or slopes, indicating constant or changing acceleration.
Zero acceleration on an acceleration vs. time graph means constant velocity with no change.
Positive acceleration indicates the object is speeding up, while negative acceleration means it is slowing down.
Understanding and describing the graphs of motion is crucial for grasping the underlying physics of movement.
Practicing drawing and interpreting graphs is essential for mastering the concept of motion in physics.
Calculations can be performed using graphs of motion, such as finding displacement or acceleration.
The slope of a graph represents the rate of change, which in physics translates to velocity or acceleration.
Graphs can help visualize complex concepts like acceleration and deceleration, making them easier to understand.
Transcripts
Browse More Related Video
Visualizing Motion Using Tape Charts and Motion Graphs | SCIENCE 7 QUARTER 3 MODULE 2 WEEK 3
Position vs Time, Velocity vs Time & Acceleration vs Time Graph (Great Trick to Solve Every Graph!!)
Position vs. Time Graph - Part 1
How Do You Graph Motion? | Physics in Motion
How to Match Motion Graphs in Physics
Position vs. Time Graph - Part 2
5.0 / 5 (0 votes)
Thanks for rating: