Calculating Probabilities of Sample Distributions with StatCrunch
TLDRThe video script explains the conditions for using a standard normal distribution to calculate probabilities, emphasizing that the original population should be normally distributed or the sample size should exceed 30. It demonstrates how to calculate the probability of an adult female's pulse rate being less than 79 bpm using a mean of 73 and a standard deviation of 12.5, and how to adjust calculations for a group of 16 females to find the probability of their mean pulse rate being under 79. The script also covers calculating the probability of an elevator being overloaded with 15 male passengers, assuming their weights are normally distributed with a mean of 179 pounds and a standard deviation of 25 pounds.
Takeaways
- 📚 To calculate probabilities using a standard normal distribution, ensure the original population is normally distributed or the sample size is greater than 30.
- 📉 For individual instances, use the mean and standard deviation provided directly for z-score calculations.
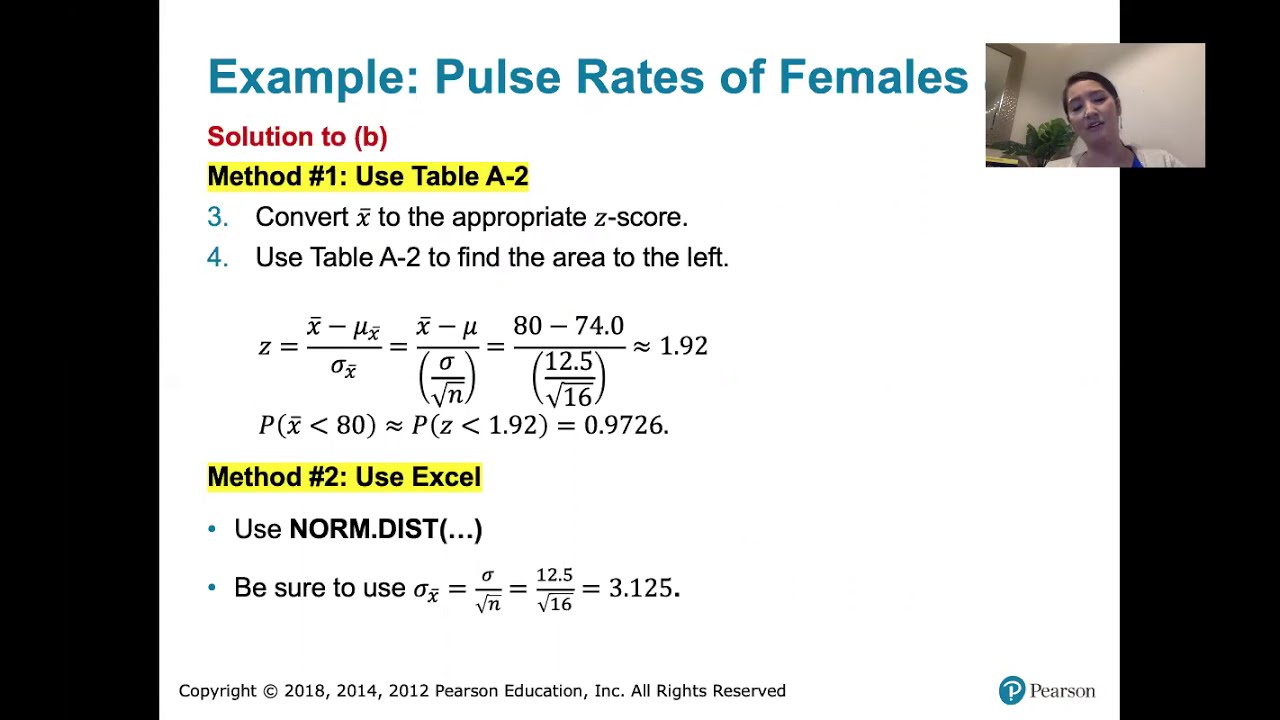
- 🔍 In the case of a normally distributed pulse rate for adult females with a mean of 73 and a standard deviation of 12.5, the probability of a pulse rate less than 79 beats per minute is calculated using StatCrunch.
- 📈 The probability for a group scenario, such as 16 adult females, requires adjusting the standard deviation by dividing it by the square root of the group size (n=16).
- 🔢 The adjusted standard deviation for the group's mean is calculated as the original standard deviation divided by the square root of the number of individuals in the group.
- 🚫 When dealing with a group, it's crucial to use the correct standard deviation for the means to accurately calculate probabilities.
- 🛗 For the elevator capacity example, the mean weight per passenger is calculated by dividing the maximum capacity by the number of passengers.
- ⚖️ To find the probability of the elevator being overloaded, use the mean weight of males and adjust the standard deviation for the group size of 15 passengers.
- 🤔 The larger the group, the smaller the standard deviation for the means becomes, which can affect the probability calculations.
- 📊 StatCrunch is used to input the adjusted values and calculate the probability that the group's mean weight exceeds the safe limit.
- 🚨 There's a significant chance (73%) that the elevator will be overloaded if the mean weight of 15 male passengers is 179 pounds, given a standard deviation of 25 pounds.
Q & A
What are the two conditions required for using a standard distribution to find probability?
-The original population should be normally distributed, or if not, the sample size must be more than 30.
What is the mean and standard deviation for the pulse rates of adult females in the given example?
-The mean (mu) is 73 beats per minute, and the standard deviation (sigma) is 12.5.
How does StatCrunch handle the calculation of probability with a given mean and standard deviation?
-StatCrunch allows you to calculate the probability directly using the given mean and standard deviation without converting to a z-score.
What is the probability that an adult female will have a pulse rate of less than 79 beats per minute according to the example?
-The probability is approximately 0.6844, or 68.44% when rounded to four decimal places.
How does the standard deviation change when calculating probabilities for a group rather than an individual?
-The standard deviation for the means is the original standard deviation divided by the square root of the group size (n).
What is the probability that a group of 16 adult females has a mean pulse rate less than 79 beats per minute?
-The probability is over 97%, specifically 0.9726.
What is the maximum capacity of the elevator in the example, and how is it related to the number of passengers?
-The maximum capacity is 2625 pounds for 15 passengers, which means each passenger can average up to 175 pounds.
What is the mean weight of adult males assumed to be in the script, and what is the standard deviation?
-The mean weight is assumed to be 179 pounds with a standard deviation of 25 pounds.
What is the probability that an elevator with 15 adult male passengers is overloaded, given the conditions in the script?
-There is a 73.23% chance that the elevator will be overloaded, as the mean weight of the group is expected to be closer to 179 pounds.
Why is it necessary to use the standard deviation for the mean when calculating probabilities for a group?
-Using the standard deviation for the mean accounts for the reduced variability in the mean of a larger group, which tends to normalize as the group size increases.
What is the key takeaway from the script regarding the use of standard deviations in different scenarios?
-The key takeaway is to use the given standard deviation for an individual and divide it by the square root of the group size (n) for a group, ensuring the correct standard deviation is used for accurate probability calculations.
Outlines
📊 Calculating Probability with a Standard Distribution
The first paragraph explains the conditions required for using a standard distribution to find probabilities: either the original population must be normally distributed or the sample size should be more than 30. It demonstrates how to find the probability of an adult female having a pulse rate of less than 79 beats per minute, given a normally distributed population with a mean of 73 and a standard deviation of 12.5. The use of StatCrunch software is highlighted, which simplifies the process without converting to a z-score, and the result is a high probability of 0.6844. The paragraph also discusses the scenario of 16 adult females and the adjustment of the standard deviation for the means when dealing with a group, resulting in an even higher probability of 0.9726.
🚫 Avoiding Overload: Elevator Capacity and Probability
The second paragraph delves into the probability of an elevator being overloaded with 15 adult male passengers, assuming their weights are normally distributed with a mean of 179 pounds and a standard deviation of 25 pounds. It explains that as the group size increases, the standard deviation for the means decreases, calculated as the original standard deviation divided by the square root of the group size (15 in this case). The expected mean weight of the group is compared against the elevator's maximum capacity per passenger, which is 175 pounds. Using StatCrunch, the probability that the group's mean weight exceeds 175 pounds is calculated, revealing a 73% chance of overload, indicating a significant risk of exceeding the safe weight limit.
📘 Summary of Standard Deviation Application in Probability Calculations
The final paragraph provides a summary of the correct application of standard deviation in probability calculations. It emphasizes the importance of using the given standard deviation for an individual and adjusting it for a group by dividing by the square root of the group size (n). It also reiterates the initial conditions for using a standard distribution: the population must be normally distributed or the sample size must exceed 30. The paragraph concludes with a light-hearted note, suggesting that the explanation provided should be straightforward and enjoyable.
Mindmap
Keywords
💡Probability
💡Standard Distribution
💡Sample Size
💡Mean
💡Standard Deviation
💡Z-Score
💡StatCrunch
💡Normal Distribution Assumption
💡Pulse Rate
💡Overloaded
Highlights
To find the probability using a standard distribution, ensure the original population is normally distributed or the sample size is more than 30.
When calculating probability for a single entity, use mean and standard deviation.
Statcrunch allows calculating probabilities using given mean and standard deviation without converting to z-scores.
Calculate the probability of an adult female's pulse rate being less than 79 bpm with a mean of 73 and standard deviation of 12.5.
For a group, the standard deviation for the means is calculated as the original standard deviation divided by the square root of the group size.
The probability that a group of 16 adult females has a mean pulse rate less than 79 bpm is over 97%.
The elevator placard states a maximum capacity of 2625 pounds for 15 passengers, implying an average weight limit of 175 pounds per passenger.
The probability of the elevator being overloaded with 15 adult male passengers, assuming a mean weight of 179 pounds and a standard deviation of 25 pounds, is calculated.
For a group, the standard deviation for the mean weight is the given standard deviation divided by the square root of the number of passengers.
The probability that the elevator is overloaded is approximately 73%, indicating a high chance of exceeding the safe weight limit.
The importance of using the correct standard deviation for the situation, either for a single entity or a group, is emphasized.
The transcript provides a step-by-step guide on using Statcrunch for calculating probabilities with normally distributed data.
The transcript explains the conditions under which the central limit theorem can be applied to calculate probabilities for sample means.
The transcript demonstrates the process of adjusting standard deviation for sample means to account for larger groups.
The concept of expected value and its role in determining the probability of certain outcomes is discussed.
The transcript concludes with a reminder to ensure the original population is normally distributed or the sample size is sufficient before applying the standard distribution for probabilities.
The importance of understanding the difference between the standard deviation for an individual and a group is highlighted.
Transcripts
Browse More Related Video

Math 14 HW 6.4.5-T Using the Central Limit Theorem

Central Limit Theorem Probability Question with Pulse Rates in StatCrunch

The Probability an Elevator is Overloaded Central Limit Theorem with StatCrunch

Math 14 HW 6.4.6-T Using the Central Limit Theorem
6.4.2 The Central Limit Theorem - Probabilities for a Range of Normally Distributed Sample Means

Normal Distribution, Z Scores, and Normal Probabilities in R | R Tutorial 3.3| MarinStatslectures
5.0 / 5 (0 votes)
Thanks for rating: